What Is a Good ROAS for eCommerce? 2026 Benchmarks Guide

Key takeways:
Good ROAS benchmarks vary by platform, industry, and business model.
Knowing your profit margins and tracking profitability are crucial for setting the right ROAS targets.
Ongoing optimization, advanced tracking, and adapting strategies per channel are key to sustainable ROAS growth.
Imagine spending $100 on Facebook ads and generating $300 in sales. That means your Return on Ad Spend (ROAS) is 3:1—every dollar you spend returns three dollars. The formula is straightforward:
ROAS = Revenue from ads / Cost of ads
However, the challenge lies in interpreting this number for your business. For a luxury jewelry brand with high margins, a 3:1 ROAS could be profitable. But, for a dropshipping store with slim margins, the same ratio might mean losing money quickly.
Why ROAS is the Heartbeat Metric for eCommerce growth
ROAS acts as your business’s financial pulse. It shows whether your ads are driving growth or wasting your budget. Unlike vanity metrics like impressions or clicks, ROAS reveals the actual revenue generated by your ad spend.
Most eCommerce businesses operate on tight margins, usually between 10-20%. If your ad efficiency drops, profits can vanish quickly.
For example, a clothing retailer spending $10,000 monthly on ads needs to know if that spend brings in $50,000 in sales. That difference determines whether the business just survives or grows.
ROAS also guides your decisions. Campaigns with strong ROAS deserve more investment. Channels that underperform should be optimized or cut. This strategy prevents wasting money on ineffective ads.
The Difference Between ROAS and ROI in eCommerce
ROAS and Return on Investment (ROI) are often confused but measure different things. ROAS shows how much revenue you earn for every ad dollar spent. ROI measures actual profit after all expenses, including product costs, shipping, and fulfillment.
For example, an eCommerce store selling fitness gear might see a 4:1 ROAS on Google Ads—$400 in revenue for every $100 spent. But if product costs consume 60% of that revenue, only $160 remains after covering those costs. Additional expenses like shipping and payment fees reduce profit further.
This distinction is crucial when scaling. You might celebrate a 5:1 ROAS but still lose money after all costs. Successful eCommerce brands monitor both metrics: using ROAS to optimize ad campaigns and ROI to ensure profitability.
Quick Answer: What Constitutes a Good ROAS for ecommerce
The average ROAS across eCommerce is 2.87:1, meaning you get $2.87 back for every advertising dollar spent. This number serves as a general benchmark but varies widely depending on the business.
For example, a luxury watch store with 80% profit margins and a dropshipping phone accessory shop can both hit the same ROAS. However, the watch store earns significant profits, while the accessory shop barely breaks even.
Different industries also show distinct ROAS averages:
Platform-Specific ROAS Expectations
Ad Platform | Average ROAS | Key Shopper Interaction | Notes |
|---|---|---|---|
Google Ads | 13.76 | Buyers actively searching for products | Leads in ROAS performance |
10.68 | Precise targeting to boost sales | Strong for targeted advertising | |
8.83 | Ideal for visually appealing products | Focus on visual product discovery | |
Amazon Ads | 7.95 | Shoppers ready to purchase | Benefits from purchase-intent audience |
2.7 | Discovery, brand awareness | Lower ROAS, excels in brand awareness | |
2.7 | Discovery, brand awareness | Similar to Twitter in role and ROAS | |
TikTok | 2.5 | Discovery, brand awareness | Great for nurturing future purchases |
(Source: https://www.vendasta.com/blog/good-roas-ecommerce/)
Why "Good" Varies by Business Model and Goals
A good ROAS depends on your business type and growth stage.
Startups with fresh funding might accept a 1.5:1 ROAS to quickly gain market share, knowing profits come later.
Established businesses with tight margins often need a 4:1 ROAS or higher to maintain healthy profits and support growth.
Subscription businesses tolerate lower initial ROAS because customers generate recurring revenue. For example, a software company might settle for 2:1 ROAS, counting on long-term customer value.
Seasonal businesses experience fluctuating ROAS. A Halloween costume shop might hit 8:1 ROAS in October but barely break even in January. Their yearly average may seem low, but seasonal peaks sustain the business.
The key is to set ROAS goals that align with your margins, objectives, and growth phase. This approach helps you outperform competitors, validate ideas with real data, and launch campaigns confidently.
Skyrocket Your E-commerce Growth

Latest ROAS Benchmarks by Platform and Industry
The ad world works like a layered ecosystem, with each platform serving a unique role. Google Ads leads with an average ROAS of 13.76 because it captures shoppers ready to buy.
For example, someone searching for “wireless headphones” is already deep in the buying process, making Google’s traffic valuable.
Facebook averages a 10.68 ROAS and focuses on interruption marketing. It turns casual scrolling into purchases through precise targeting.
A skincare brand might not get Google-level returns. Facebook’s ability to target specific interests and behaviors often compensates for lower buying intent.
Instagram’s 8.83 ROAS shows the strength of visuals. Products that look appealing in photos—such as fashion, home decor, and fitness—perform well here. The difference between Instagram and Facebook lies in user behavior: Instagram users seek inspiration, not direct sales pitches.
Amazon Ads delivers a 7.95 ROAS by targeting bottom-funnel shoppers ready to buy. This works well for product-focused brands but offers less brand control and more competition for attention.
Twitter and Pinterest both hover around a 2.7 ROAS but for different reasons. Twitter’s text-heavy, news-driven environment makes ads feel out of place.
Pinterest acts as a visual search engine where users look for ideas. Despite similar numbers, their user journeys and strategies differ significantly.
TikTok’s 2.5 ROAS reflects its evolving nature. Some brands succeed, while others struggle to convert viral moments into sales. The platform’s young, entertainment-focused audience presents unique challenges for direct response ads.
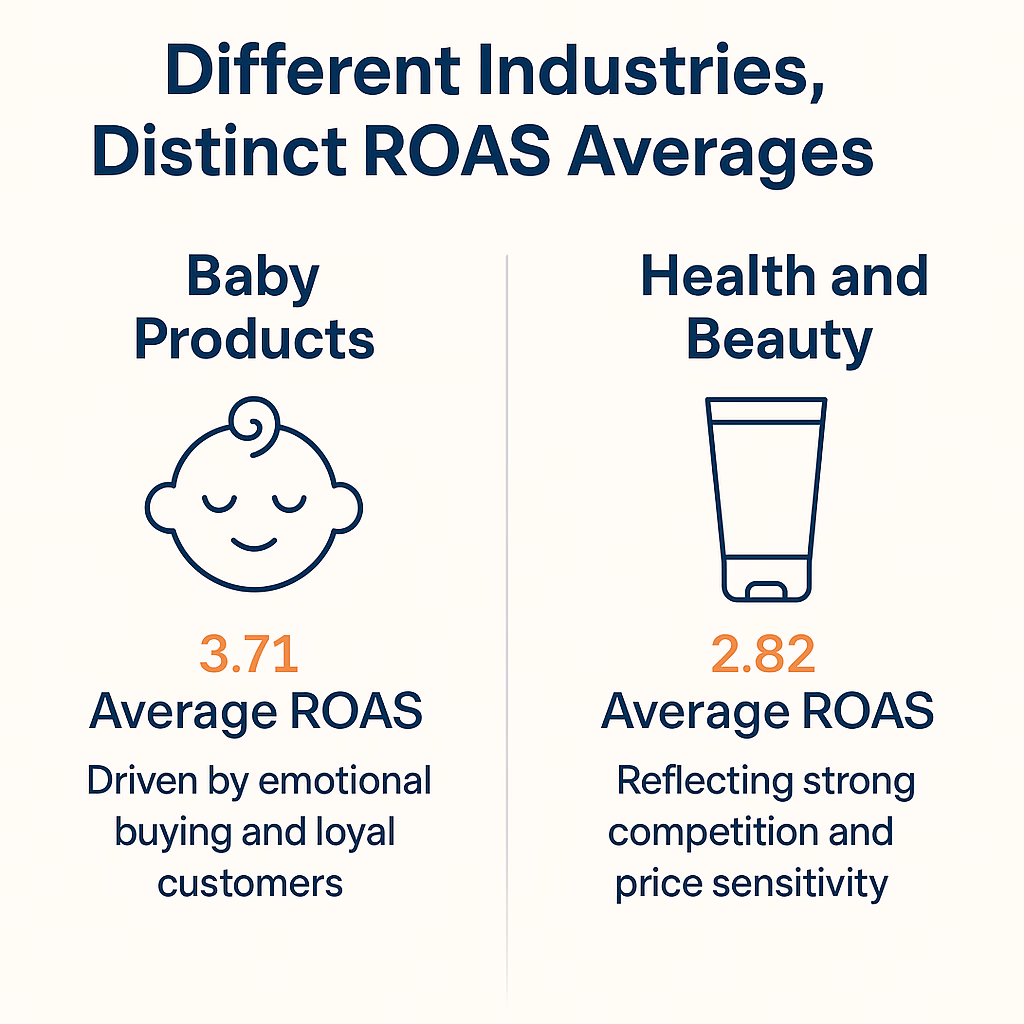
Industry-Specific Benchmarks: Baby Products, Health and Beauty
Industry benchmarks reveal how product categories affect ad results. Baby products lead with a 3.71 average ROAS because new parents are motivated buyers who prioritize quality and safety. Their urgency and higher order values for premium products boost ROAS.
For instance, a baby monitor brand benefits from parents seeking real solutions. This immediate need, combined with higher prices, results in better returns on ad spend. You can track these benchmarks with tools like Trendtrack.
Health and beauty averages a 2.82 ROAS and presents more challenges. Shoppers research, compare options, and seek social proof before buying. Since skincare routines require commitment, buyers approach new brands cautiously.
Influencer marketing and user-generated content add complexity. Shoppers trust peers more than ads, so brands must build relationships instead of pushing quick sales. This approach may lower immediate ROAS but strengthens brand loyalty over time, and can be scaled more effectively through the right UGC platform.
Luxury goods often achieve higher ROAS despite premium prices. Customers have more spending power and care less about price. For example, a $200 serum can outperform a $20 drugstore product because luxury buyers make less price-sensitive decisions.
Consumer electronics face unique challenges. High prices and long research periods mean shoppers take time. Buying a laptop might involve weeks of comparison and review reading. So, measuring ROAS from a single campaign doesn’t capture the full customer journey.
Want to dive deeper into tracking and optimizing your ad performance across different industries? Explore advanced tracking tools to get real-time insights and benchmarks for your specific product category.
B2B vs B2C ROAS Expectations
B2B and B2C businesses operate differently. B2C sales usually happen quickly, making it easy to link ad spend to revenue. B2B deals can take months and involve multiple decision-makers, complicating ROAS tracking.
A B2B company targeting a 3x ROAS must think long-term. For example, spending $1,000 to acquire a customer who pays $3,000 annually looks good. However, the real value accumulates over several years. B2B brands accept lower initial ROAS because the payoff grows over time.
Lead generation adds complexity. If a lead costs $100 but results in a $10,000 sale six months later, traditional ROAS calculations don’t fit. Many B2B brands track cost per lead and link it to revenue later for clearer insights.
B2C ecommerce gets instant feedback but faces challenges like seasonal swings, inventory issues, and shipping costs. A fashion retailer might see 5x ROAS during holidays but only 2x in the off-season.
Subscription models blur these lines. A meal kit service selling to consumers uses B2B-style lifetime value math. Meanwhile, a project management tool for small businesses may see quick, B2C-like conversions.
These hybrid businesses need tailored ROAS strategies that consider retention, churn, and upsells.
Build Smarter Marketing Funnels
Match ads to landing pages and understand how successful brands structure their funnels. Get inspiration for your own marketing strategies.
How to Calculate Your Personalized Target ROAS
The idea of a “good ROAS” depends entirely on your business. Think of ROAS targets like speed limits: 25 mph works in a school zone but is too slow on a highway. Your business model, profit margins, and growth stage all shape what a reasonable return looks like for you.
Understanding Your Profit Margins and Breakeven ROAS
Your profit margin forms the foundation of every ROAS calculation. For example, if you sell skincare with 80% margins, you can set much lower ROAS targets than a store with 15% margins. The formula is simple:
Breakeven ROAS = 1 ÷ Profit Margin
For instance, Brand A sells premium supplements with a 60% margin. They only need a 1.67:1 ROAS to break even. Brand B sells electronics at a 20% margin and needs a 5:1 ROAS just to stay afloat.
This explains why supplement brands can scale quickly with a low ROAS. A 3:1 ROAS is excellent for supplements.
Factoring in COGS, AOV, and Operational Costs
ROAS alone can mislead if you ignore your real costs. For example, a T-shirt brand might celebrate a 4:1 ROAS. Until the factor in production, shipping, payment processing, and customer service costs that reduce profits.
Calculate your true profit margin by including every variable cost per sale. If your $30 T-shirt costs $8 to make, $4 to ship, $1 for payment processing, and $2 for customer service, your real margin is 50%. Not the 73% you’d get by only considering production costs.
Average order value (AOV) also affects ROAS. Higher AOV spreads fixed costs like payment processing and customer acquisition over larger transactions.
For example, a jewelry brand can afford higher acquisition costs than a phone accessories shop even if their margins are the same.
Using CLV to Determine Acceptable Acquisition Costs
Customer lifetime value (CLV) shifts ROAS from a quick snapshot to a long-term strategy. Subscription businesses or those with many repeat buyers can accept a lower initial ROAS because they recover costs over time.
For example, a coffee subscription service might accept a 2:1 ROAS on first orders. If each customer brings in $180 over their lifetime from a $30 start.
The first sale barely breaks even, but the long-term payoff is significant. Subscription brands can outbid competitors for top keywords even if their acquisition costs seem high initially.
CLV becomes more useful when broken down by channel. Customers from Google Search might be worth 40% more over time than those from Facebook. This allows you to set different ROAS targets for each platform instead of using a one-size-fits-all approach.
Skyrocket Your E-commerce Growth
Setting Realistic Targets Based on Business Stage
Your business stage influences your ROAS targets. Startups often prioritize growth and market share, accepting lower ROAS to scale quickly. Established brands need higher ROAS to protect profit margins and satisfy investors.
For example, a new skincare brand might aim for a 2.5:1 ROAS in its first year to build a customer base. After three years, the same brand might require a 4:1 ROAS to justify continued ad spend. As your business matures, your priorities and efficiency change—and so should your ROAS targets.
Market competition also affects ROAS. Entering a crowded market usually means accepting lower ROAS initially while building your share. Finding an underserved niche lets you set higher targets due to less competition and cheaper acquisition.
Set your ROAS targets based on your own goals and numbers—not someone else’s average. Use real data to validate ideas, launch confidently, and stay ahead of competitors.
Proven Strategies to Improve Your ecommerce ROAS
Turning a struggling campaign into a winner requires focusing on three key areas. Think of campaign optimization like tuning a high-performance engine—every part must work together for the best results.
Start with hyper-specific targeting. Instead of showing your ads to everyone, focus on your ideal customers. Build campaigns around detailed personas, target regions with the best returns. Aim at behaviors that indicate real buying intent.
For bidding, manual control often outperforms automated options. Platforms promote automated bidding, but adjusting bids based on actual performance gives you more control.
Increase bids for keywords and audiences that convert, and reduce bids where results lag. Concentrate on one campaign at a time for sharper results.
Creative testing goes beyond simple A/B splits. The best brands test multiple headlines, descriptions, and visuals, allowing each variation enough time to gather meaningful data.
Responsive search ads help by mixing and matching your inputs to find what works, while you focus on creating quality content.
Landing Page Optimization for Higher Conversions
Your landing page is where conversions happen or fail. If your ad and landing page messages don’t match, even the best campaign will struggle. Keep your message consistent from the ad through to checkout.
Make sure your landing page delivers on your ad’s promise. For example, if your ad highlights free shipping, feature that prominently on the page. Emphasize the benefits you promoted so visitors see them immediately.
Page speed and user experience are critical. A slow or confusing page will drive potential customers away, no matter how good your ads are. Keep navigation simple, calls to action clear, and ensure the page looks great on mobile devices. These basics are essential to boost your ROAS.
Remarketing and Audience Segmentation Strategies
Remarketing targets people who already know your brand, making it a powerful way to improve ROAS. These warm leads convert better and cost less to acquire, maximizing your ad budget.
Dynamic remarketing takes this further by showing shoppers the exact products they viewed before. This gentle reminder encourages them to return without feeling pushy.
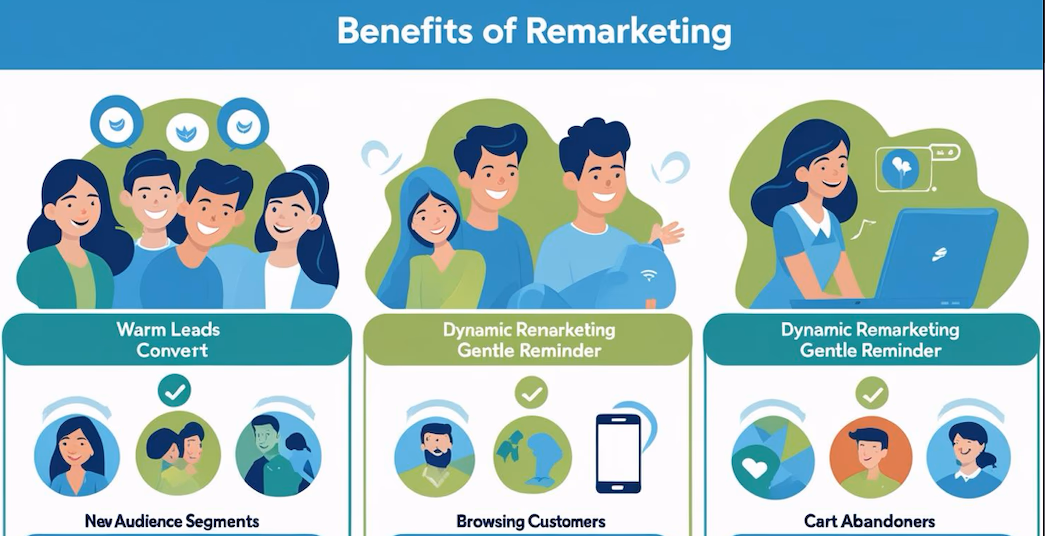
Audience segmentation lets you customize your message based on where someone is in your sales funnel. New visitors might see broad brand content, while cart abandoners receive special offers to close the sale. This targeted approach makes every interaction more relevant and effective.
Platform-Specific Optimization Techniques
Each ad platform has unique features, algorithms, and best practices. Google Ads Performance Max uses machine learning to optimize across all Google properties. It saves time and increases conversions with automated adjustments.
Facebook and Instagram share an ad platform but attract different audiences. Instagram users prefer eye-catching, native-feeling visuals. On the other hand, Facebook shoppers respond better to detailed information and social proof.
Amazon shoppers are ready to buy, so focus on highlighting what makes your product stand out rather than just building awareness.
Top ecommerce brands treat each platform as a separate channel with unique strategies and audiences. Avoid a one-size-fits-all approach. Customize your tactics for every platform to outperform competitors. Validate ideas with real data, and launch campaigns confidently.
Advanced ROAS concepts for Scaling ecommerce Brands
Relying on last-click attribution is like giving all the credit for a soccer goal to the final pass. Your Facebook ad might introduce someone to your brand. Google Search catches them when they’re ready to buy, and email marketing closes the deal days later.
Multi-touch attribution spreads credit across every step, revealing what truly drives results. For example, a customer might:
See your Instagram ad
Visit your site
Leave
Get a retargeting email
Click through
Abandon their cart
Finally buy through a Google Shopping ad
Last-click attribution would give Google all the credit. However, multi-touch might split it—30% to Instagram, 25% to email, 45% to Google.
This changes how you view ROAS. An Instagram campaign showing a 1.5:1 ROAS under last-click might actually deliver a 4:1 ROAS.
Incrementality testing goes further. Pause certain campaigns for specific audiences and observe what happens to conversions. This method measures the true lift your ads provide.
POAS vs ROAS: Accounting for True Profitability
ROAS shows how much revenue your ads generate, but it doesn’t reveal profit. Selling a $100 product with $80 in costs differs greatly from selling a $100 digital product with $5 in delivery costs.
Profit on Ad Spend (POAS) focuses on profit divided by ad spend, giving a clearer picture of profitability. For example:
Spend $20 on ads to sell a $100 product
ROAS is 5:1
Profit is $20
POAS is 1:1, meaning you break even
This becomes critical as you scale. A 3:1 ROAS might look good, but if your POAS is 0.8:1, you lose money on every sale. Subscription brands sometimes accept negative POAS upfront, knowing customer lifetime value will compensate.
AI and Automation Tools for ROAS Optimization
Ad platforms now use machine learning to optimize bids in real time. Google’s Target ROAS bidding predicts conversion chances for every auction using many signals like device and location.
These algorithms need data to improve. A campaign with 50 conversions a month won’t optimize as well as one with 500. It’s a chicken-and-egg problem. You need volume for efficiency, but you need efficiency to justify more volume.
The best approach is to start with manual bidding to gather solid conversion data. Then switch to automated strategies as you scale. Use broad match keywords with smart bidding to let the algorithm find profitable search terms you might miss.
Performance Max campaigns take this further by using AI to find customers across all of Google’s properties. You lose some control over where your ads appear. However, the algorithm often discovers high-performing audiences you wouldn’t find on your own.
Balancing Growth vs Profitability Targets
Every scaling decision balances growth and profitability. Venture-backed startups often chase market share, accepting lower ROAS to win customers before competitors. Bootstrapped brands need positive returns from day one.
This mindset shapes your ROAS targets.
For example:
Funded companies might accept a 2:1 ROAS while investing in brand awareness and customer acquisition
Self-funded businesses might require a 5:1 ROAS to maintain cash flow and growth
The right balance depends on your market and funding. In crowded markets, aggressive acquisition can pay off long-term, even if short-term ROAS suffers. Amazon ran on thin margins for years to build dominance. But, that only works with outside funding or strong customer lifetime value.
Consider your payback period. If your average customer brings in $300 over their lifetime and costs $100 to acquire, you can accept a 1:1 ROAS on the first sale. Of course, if your retention rates support it. Track cohorts over time to verify assumptions and adjust targets accordingly.
Most of the ecommerce brands set different ROAS targets for different campaigns. For example:
Brand awareness campaigns might aim for 1.5:1
Remarketing campaigns might target 8:1
This portfolio approach maximizes both growth and profit by aligning goals with the right metrics.It seems section 8 is missing. Please provide the content for section 8, and I will improve its readability, human tone, and clarity as requested.
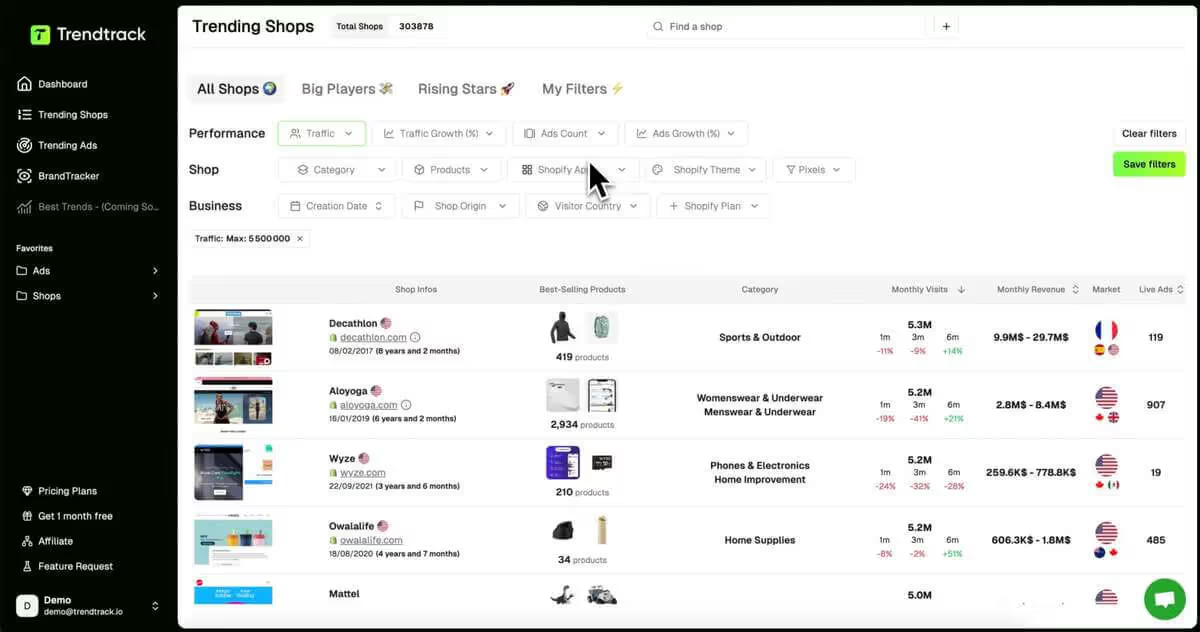
How to Calculate ROAS with Trendtrack
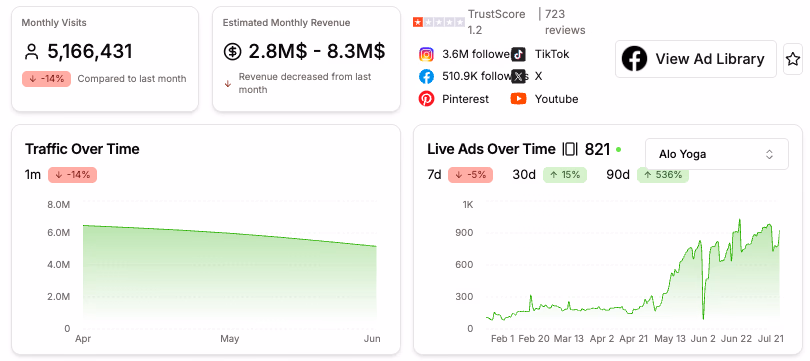
While Trendtrack doesn’t show exact ad budgets, it gives valuable clues. You can see product pricing, store revenue estimates, and how aggressively stores are advertising. This helps estimate if a product is likely producing a strong ROAS.
Use Ad Trends and Engagement Volume as ROAS Indicators
You have to check couple of things. First, ask your self if the product is being advertised heavily across multiple platforms. Other question is are those ads have high engagement.
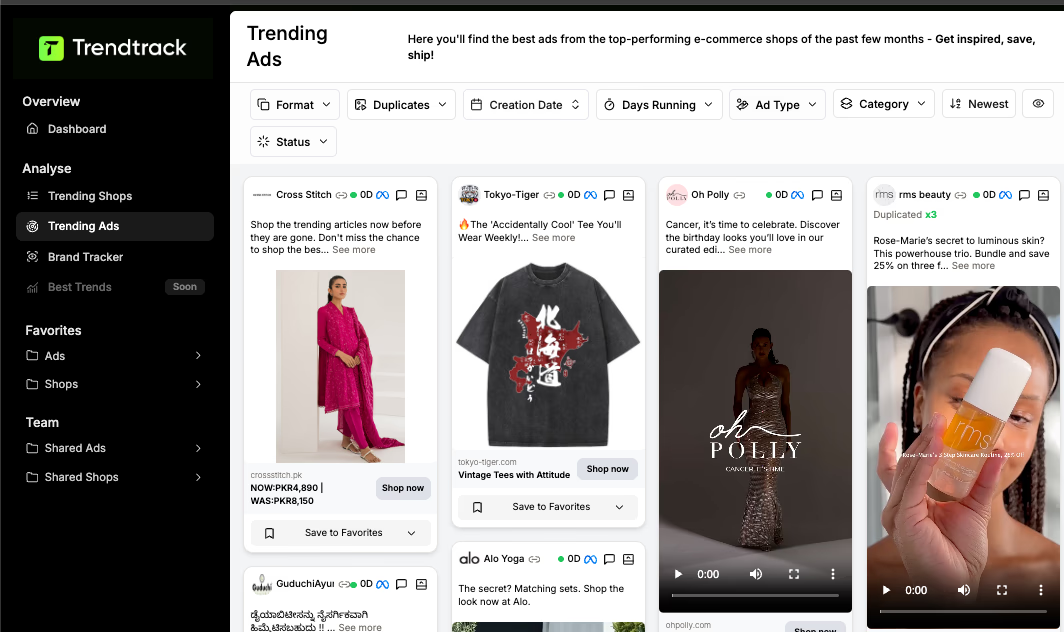
If the answer is yes for both of these, it’s a strong sign the ROAS is working in that store’s favor. Trendtrack’s BrandTracker” tab helps you track this pattern.
Want to dive deeper into how top ecommerce brands track their advertising performance? Check out the best ad tracker tools to get real-time insights into ROAS and marketing effectiveness.
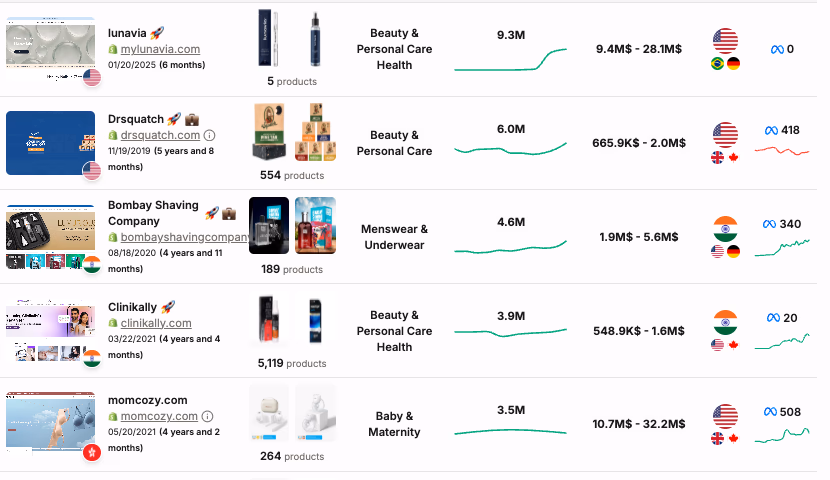
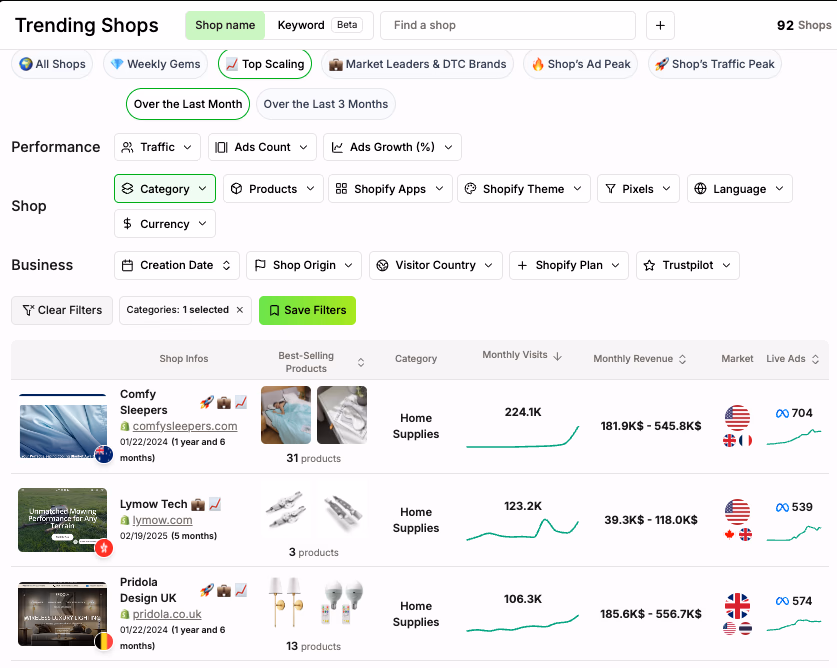
Spot Consistent Revenue Growth Across Stores with Similar Products
Trendtrack lets you filter stores by product type and see their estimated monthly revenue and traffic. If multiple stores are scaling the same item with stable growth, it suggests that product can support sustainable ROAS.
Calculate Break-Even ROAS With Your Own Cost Assumptions
While Trendtrack doesn’t calculate ROAS directly, you can plug product price and estimated ad spend into a simple formula.
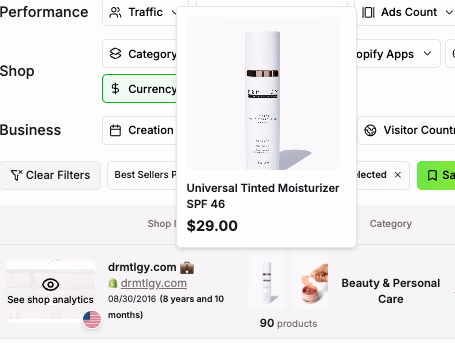
For example:
Product price: $29
Cost of goods + shipping: $10
Break-even ROAS = $29 ÷ $10 = 2.9
Use Trendtrack data to validate whether stores selling at similar prices are likely meeting that threshold.
Save Hours of Research Time
Stop checking five different tools. Trendtrack provides better insights in one platform. Save time and streamline your research workflow.
You Can Also Use This ROAS Calculator
If you prefer a visual way to figure things out, you can also use tools like this ROAS Break-Even Calculator:
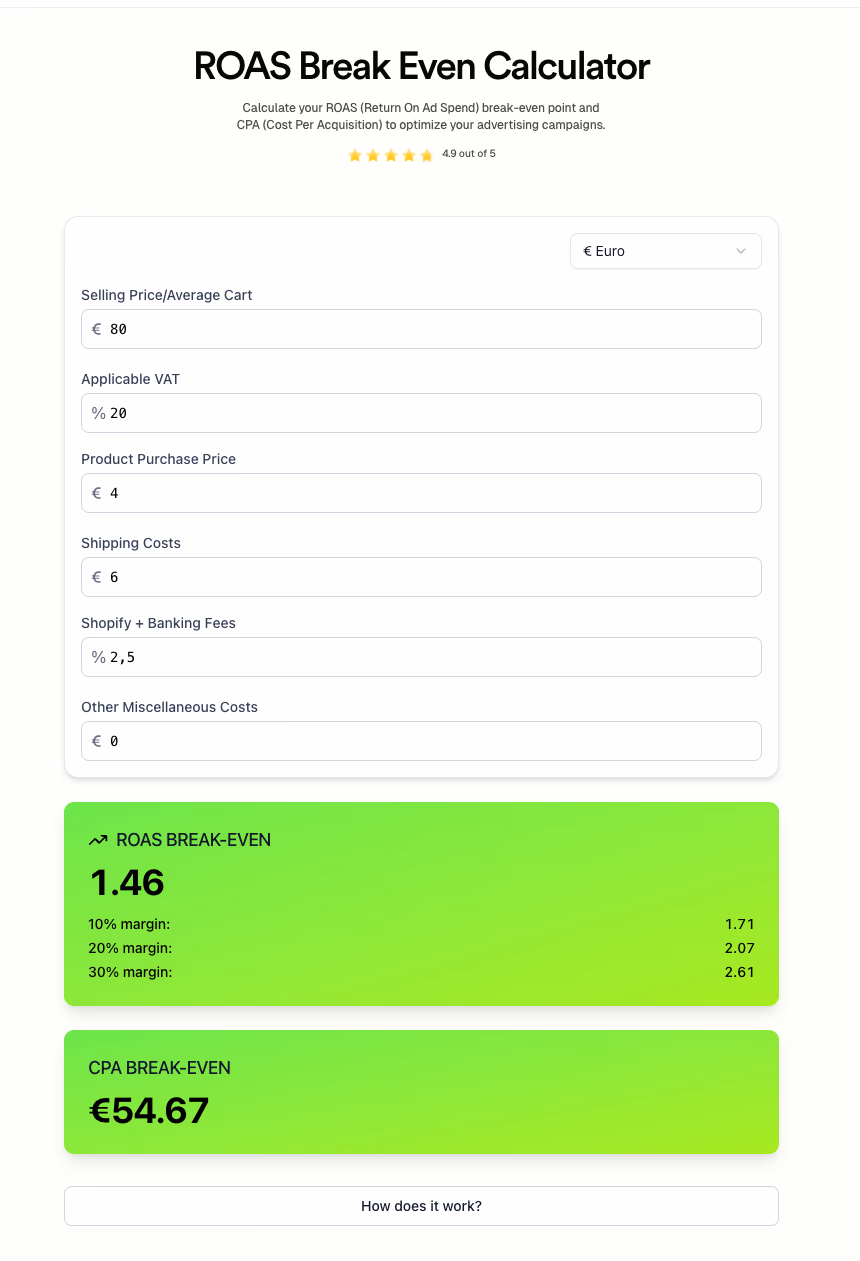
In the example above:
The product sells for €80
Costs include VAT (20%), product price (€4), shipping (€6), and Shopify + banking fees (2.5%)
Based on that, your break-even ROAS is 1.46. This means you need to make at least €1.46 for every €1 spent on ads just to not lose money.
And if you want actual profit:
ROAS of 1.71 gives you 10% profit
ROAS of 2.07 gives you 20% profit
ROAS of 2.61 gives you 30% profit
It also shows your CPA break-even at €54.67 — so if you’re paying more than that to get a customer, it’s time to adjust.
If you like the tool, check out our ROAS Calculator to discover proven methods for improving your campaign performance!
Final Words
Remember that achieving good ROAS isn't just about hitting arbitrary benchmarks. Success comes from understanding your unique business metrics. Plus, continuously testing and optimizing your campaigns, and staying informed about what's working in your market right now.
The most profitable ecommerce businesses treat ROAS optimization as an ongoing process rather than a one-time calculation.


.avif)


Are you ready to get the insights?
From viral trends to million-dollar stores — unlock the insights behind what sells, scales, and converts. All in one place.