TikTok vs Meta CPM Benchmark Data for 2026


CPM is the “cover charge” you pay to enter someone’s feed. Right now, the TikTok vs Meta CPM gap is real but shrinking. For ecommerce advertisers this matters because TikTok was the cheap reach option. Now it is pricing itself closer to Meta, which has dominated performance budgets for years.
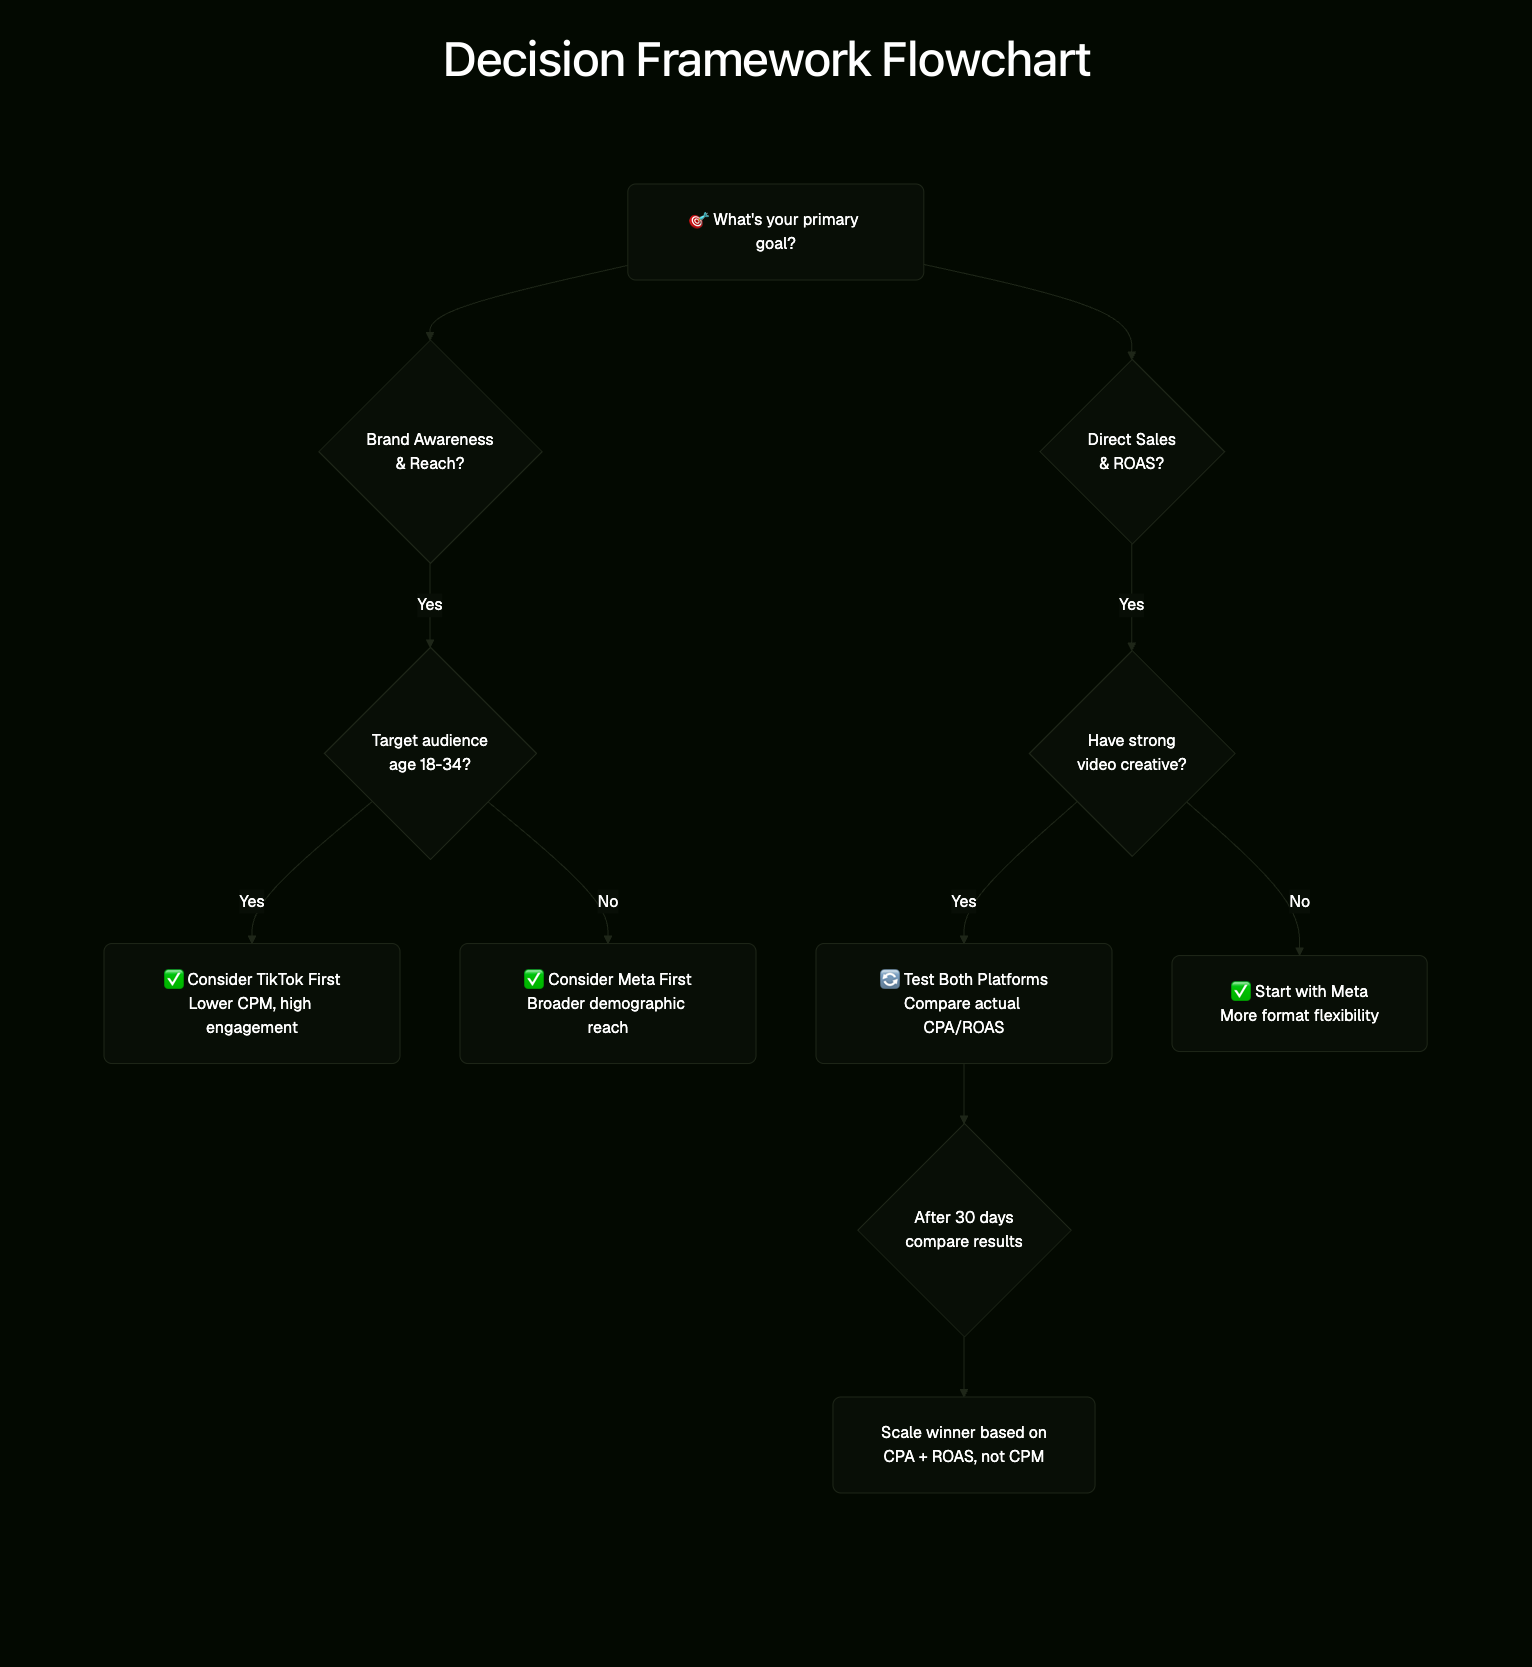
Treating CPM like a scoreboard is a trap. A lower CPM can be a gift or a warning sign that you’re buying cheap impressions that don’t convert. Let's look at clear benchmarks and what those numbers mean for ROI.
The CPM gap is shrinking as TikTok matures from a "cheap reach" tool into a high-performance channel.
Higher conversion rates often make Meta more profitable despite its higher initial cost for impressions.
Success requires tracking ROAS and net-new customers rather than chasing the lowest platform entry fee.
TikTok vs Meta CPM benchmarks
TikTok impressions typically cost less than Meta impressions. From the benchmark data:
TikTok CPM usually ranges between $3 and $10, offering cheaper distribution. Performance depends heavily on how native and engaging the video feels.
Meta CPM usually ranges from $7 to $15, offering more expensive reach but commonly more conversion. Ready traffic for ecommerce campaigns.
On paper, TikTok looks like it delivers about twice the impressions for the same money. But the “price per 1,000” is just one part of your cost. The second factor is creative quality. TikTok punishes “acceptable” ads and rewards ads that feel like content.
If you’ve noticed Meta CPM staying stable while TikTok CPM swings wildly, you’ve experienced TikTok’s creative auction in action. TikTok can be cheap when you engage users and costly when you don’t.
CPM gap over time
The key story is the shrinking gap between platforms. According to EMARKETER, the difference between TikTok’s and Meta’s average CPM was:
Period | TikTok avg CPM | Meta avg CPM | CPM gap |
|---|---|---|---|
Q1 2022 | ~$4.50 | ~$13.12 | $8.62 |
Q1 2023 | ~$5.50 | ~$12.50 | $7.00 |
Q1 2024 | ~$6.50 | ~$12.50 | $6.00 |
Q1 2025 | ~$7.00 | ~$12.50 | $5.50 |
This shows TikTok is no longer just an experiment. Ecommerce teams should note:
The idea that TikTok is always cheaper is outdated. Relying on TikTok as a permanent bargain is risky.
Rising CPM means higher expectations for performance. When CPMs climb, advertisers focus on the revenue generated by those impressions, not just engagement or views.
This shift happens as platforms mature. More brands putting real budgets into the auction drives up costs.
What rising TikTok CPM means for ROI
Higher TikTok CPM usually signals these trends:
More advertisers are bidding in the auction.
Brands treat TikTok more like a performance channel needing scale.
The platform is improving measurement, attracting budgets from elsewhere.
Higher CPMs are acceptable if impression quality improves. This means:
TikTok CPM does not guarantee efficient customer acquisition.
Meta CPM does not mean Meta is overpriced.
CPM reflects the platform’s fee for access. As TikTok CPM rises closer to Meta, expect TikTok to be judged on actual business results. To manage rising TikTok CPM effectively:
Don’t cut spend immediately if CPM rises. Check if engagement improved, indicating better user response, or if your creative underperformed.
See “cheap CPM” as temporary, not a strategy. Build systems to create ads that perform well in the auction. This protects you when low-cost days end.
Adjust your definition of success. As TikTok matures, teams need cleaner performance data instead of settling for low-cost reach with weak conversions.
In short, TikTok is moving from “discount impressions” to pricing itself as a core advertising channel. Ecommerce advertisers should stop focusing on CPM alone and start tracking outcomes. The next challenge is comparing those outcomes properly, because CPM alone can mislead your decisions.
Want to understand how TikTok's auction system affects your CPM? Learn more about TikTok ad costs and how platform dynamics shape pricing across different industries.
How to compare TikTok vs Meta CPM
Comparing CPM alone is like shopping for rent by price per square foot without checking the neighborhood. TikTok often appears cheaper on impressions. But ecommerce advertisers don’t earn money from CPMs. They earn money from purchases.
The better approach is to connect impressions → clicks → sessions → conversions → revenue. Then, consider how each platform measures conversions.
CPM vs CPC vs CTR vs CVR
CPM is the cost of access. The real business outcome depends on what happens after the impression.
Metric | What it measures | TikTok | Meta Platforms | Key takeaway |
|---|---|---|---|---|
CPM | Cost for 1,000 impressions | ~$3–$10 | ~$7–$15 | Cheap reach matters only if audience quality is high |
CPC | Cost per click | ~$1–$1.80 | ~$1–$1.80 | Similar CPC ≠ similar buying intent |
CTR | % of viewers who click | Often higher (strong hooks) | Often lower | High curiosity clicks don’t always convert |
CVR | % of clicks that purchase | ~1.5–3% | ~2–15% | Conversion rate determines real profitability |
A few additional considerations:
CPM as entry fee: Think of CPM as paying for access. TikTok may win on entry cost, but if your product doesn't fit that traffic, your CPA will suffer.
Similar CPC ≠ similar intent: Both platforms have comparable click costs. However, Meta clicks often come from users closer to purchase.
Curiosity vs intent clicks: TikTok's hooks drive clicks, but many are curiosity-driven rather than purchase-ready.
CVR is the real test: Conversion rate determines whether cheap traffic actually saves money. This is where the platforms diverge most.
Also consider the creative investment. TikTok's cost-effectiveness depends heavily on quality video content. Without effective in-feed videos, the "cheap CPM" advantage vanishes. For inspiration, see these best ad creatives analyzed with real data.
CPA and ROAS tradeoffs
A common mistake is assuming TikTok is more efficient just because it has a lower CPM. In ecommerce, efficiency depends on CPA and ROAS, not CPM alone.
Here’s what typical data shows:
TikTok usually has better cost-per-click and engagement.
Meta tends to deliver stronger return on ad spend (ROAS). If you're unsure what target to aim for, check out what's a good ROAS for Facebook Ads.
The conversion gap between platforms is significant (see metrics table above).
This explains why two campaigns can look like this simultaneously:
TikTok: lower CPM, sometimes lower CPA, but weaker ROAS.
Meta: higher CPM, but stronger ROAS because its traffic converts better.
To test the CPM gap, imagine this:
TikTok costs $4 CPM and Meta costs $8 CPM (double).
If Meta’s visitors convert at higher rates, Meta can cost less per purchase, even with higher CPM.
So, instead of asking “Which CPM is lower?” focus on:
What CPM would TikTok need to offset its conversion gap versus Meta?
What difference in ROAS am I willing to accept to gain additional reach?
This is critical for top DTC brands where more volume means little if it reduces profit margins.
Attribution and measurement differences
Even with solid funnel math, measurement can distort comparisons because TikTok and Meta use different attribution methods.
TikTok and Meta use different attribution methods. See comparison below:
Attribution setting
TikTok
Meta
Default click window
7 days
7 days
Default view window
1 day
1 day
Max click window
28 days (limited)
28 days
View-through options
1 day only
1 day (more flexible)
Net-new CPA delta
~10%
~38%
This affects what counts as a conversion.
Platform metrics show Meta clearly winning, while first-party attribution reveals both platforms performing similarly. In some cases, a "net new" view shows TikTok ahead. TikTok had a lower delta between CPA and net-new CPA (10%) compared to Meta's 38%.
This indicates TikTok generated more new customers while Meta spent more on existing ones. For ecommerce teams, this means:
Don’t pick a CPM winner based only on platform-reported ROAS. Tighter attribution windows can undercount conversions.
Segment your data carefully. Always check CPA/ROAS along with net-new customer metrics because cheap conversions aren’t always new customers.
To avoid guessing, treat:
CPM as the input,
CVR, CPA, and ROAS as the output,
attribution settings as the lens that affects both.
Aligning these factors turns the TikTok vs Meta debate into a clear budget allocation decision.
Why TikTok and Meta CPM differ
CPM isn’t a fixed price. It results from auctions. Two platforms can show the same product to the same person on the same day but produce very different CPMs. This happens because of differences in audiences, ad inventory, and advertiser expectations.
For ecommerce teams, the lesson is clear. Stop searching for a single benchmark. Instead, understand why auctions behave differently before deciding where to spend $10k per day. If you need help planning, learn how to calculate Facebook ads budget properly.
Audience and demand dynamics
Meta's main strength is its wide reach across virtually all age groups. This diverse audience attracts many advertisers with different goals and varying willingness to pay. More competition in an auction usually means higher prices.
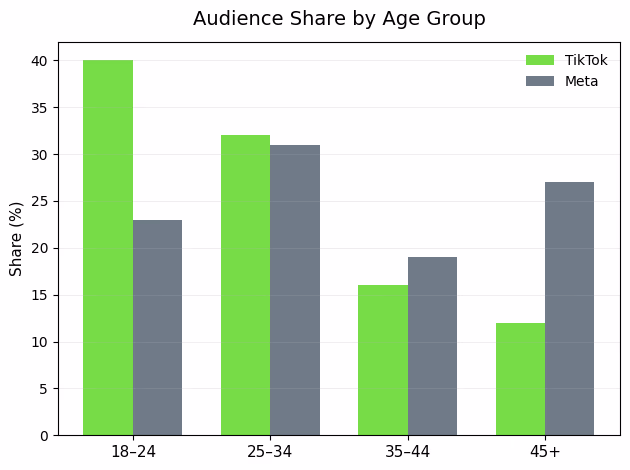
TikTok's audience skews younger (see table above). This doesn't always mean lower costs but shapes the demand pool differently:
Brands targeting Gen Z and young millennials often find TikTok delivers relevant attention quickly. Usually at lower CPMs.
Brands aiming for older or higher-spending consumers see Meta attract advertisers who bid aggressively for ready-to-convert users. This keeps CPMs high.
There’s also the overall market size. TikTok’s US ad revenue is expected to reach $14.5 billion, about 9% of Meta’s $150 billion. This difference shows how much advertiser demand each platform handles.
Platform risk adds uncertainty. A potential TikTok ban in the US could shift ad spend to Instagram Reels and YouTube Shorts, pushing prices up there. Such uncertainty influences how advertisers schedule budgets and bid aggressively.
When higher TikTok engagement raises CPM
Many assume CPM is just a cost for reach. On TikTok, CPM often reflects the price of attention. When content feels native enough to stop users from scrolling, advertisers accept higher CPMs because performance improves.
This highlights a key auction dynamic:
If your creative boosts engagement, the platform delivers ads more efficiently. More people watch or click. Advertisers tolerate higher CPM because the overall results justify it.
Poorly matched creative leads to low engagement. CPM might appear cheap, but results suffer since many impressions are ignored.
This explains why TikTok can seem paradoxical for ecommerce. It often delivers lower CPC and higher engagement, but Meta sometimes produces stronger ROAS overall.
Rising TikTok CPM can actually signal healthy competition for inventory that drives real outcomes. Especially if your creative performs well.
Want to see what creative strategies are actually winning on TikTok right now? Check out TikTok ad examples to understand which native-feeling formats drive the engagement and CPM efficiency mentioned above.
Platform maturity and advertiser mix
Meta has built ad-system maturity for years. It started in 2007 with features like interest and behavior targeting and lookalike audiences. This maturity improves targeting and attracts performance advertisers willing to pay more for predictability.
TikTok is moving in the same direction, aiming to attract more performance marketing dollars. As more brands shift spend to TikTok as a must-buy platform, CPMs rise.
As covered earlier, the CPM gap continues to narrow. This reflects more direct-response buyers entering TikTok's auctions, bidding higher for measurable ROI.
Measurement also affects perceived CPMs. TikTok’s attribution limits ads to one view per person within one day and tracks conversions for up to seven days.
Meta offers longer reporting windows. When platforms see less of the conversion path, advertisers may underbid or overreact, causing fluctuating CPMs. If you’re allocating ecommerce budgets, consider this framework for the CPM gap:
What drives CPM differences? | TikTok tendency | Meta tendency |
|---|---|---|
Audience shape | Skews younger (mostly 18–24) | Broad reach across age groups (18–24, 25–34, 35+) |
Buyer intent vs attention | Focuses on attention and engagement; strong creative can raise CPM | Often attracts conversion-ready traffic, with higher bids |
System maturity | Improving targeting and measurement; moving toward performance marketing | Mature platform with robust targeting since 2007 |
Market direction | CPMs rising toward Meta levels (see gap trend above) | Higher baseline CPM, absorbs spend if TikTok disrupted |
The main point: CPM differences show who is in the auction, what they aim for, and how confident they are in measurement. Instead of asking which CPM is lower, ask which auction prices the outcome you want to buy.
How to use Trendtrack for TikTok vs Meta CPM advantage
CPM benchmarks provide numbers, but they don’t tell you what to do with a real budget and creative on Monday morning. The challenge isn’t simply that “TikTok is cheaper” or “Meta is more expensive.”
CPM changes over time as platforms evolve. Your competitors adapt faster than teams can track manually.
Trendtrack connects two key insights that CPM doesn’t reveal:
What competitors are actually running (creative, volume, duration)
Whether they are gaining traffic momentum
This approach helps you stop debating CPM on its own and start making budget decisions based on evidence.
Track competitor ads with ad libraries
Relying on CPM alone to predict performance means you’re already behind. A better method is to base your expectations on market behavior. What your competitors launch, repeat, and sustain to capture the same audience. Start with these native sources:
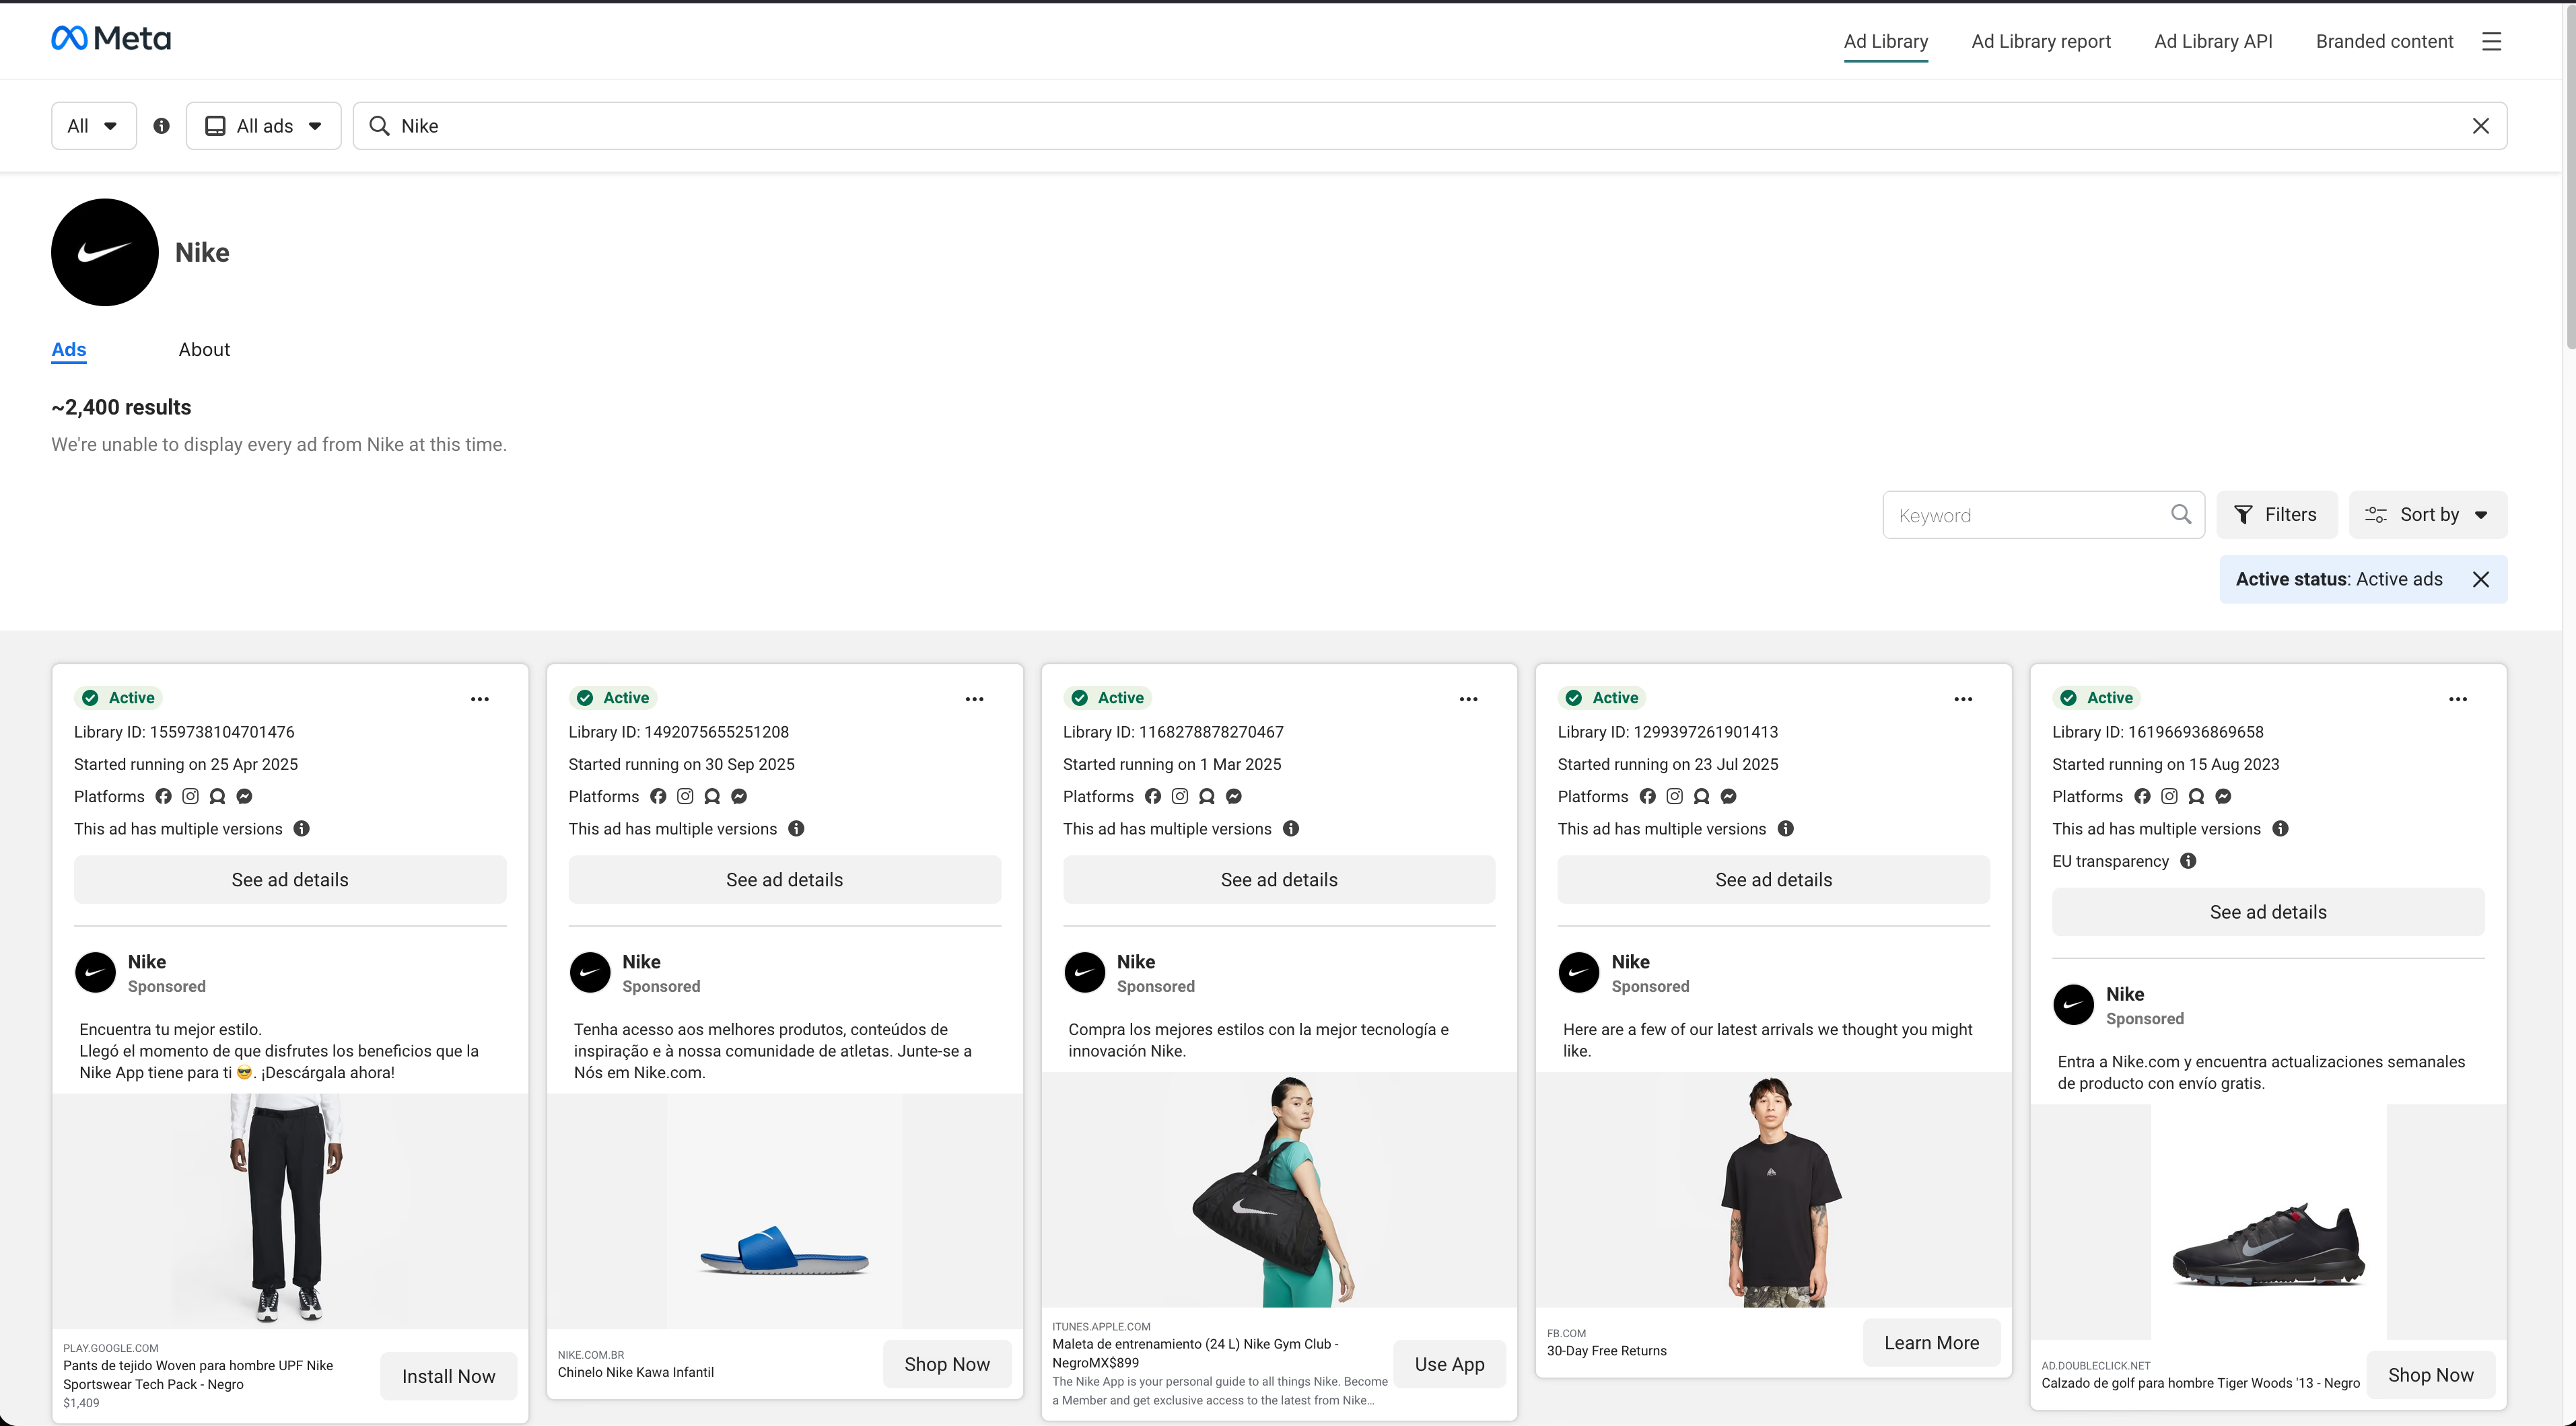
Meta Ads Library displays every active Facebook and Instagram ad. It shwos how competitor messaging changes over time and by country.
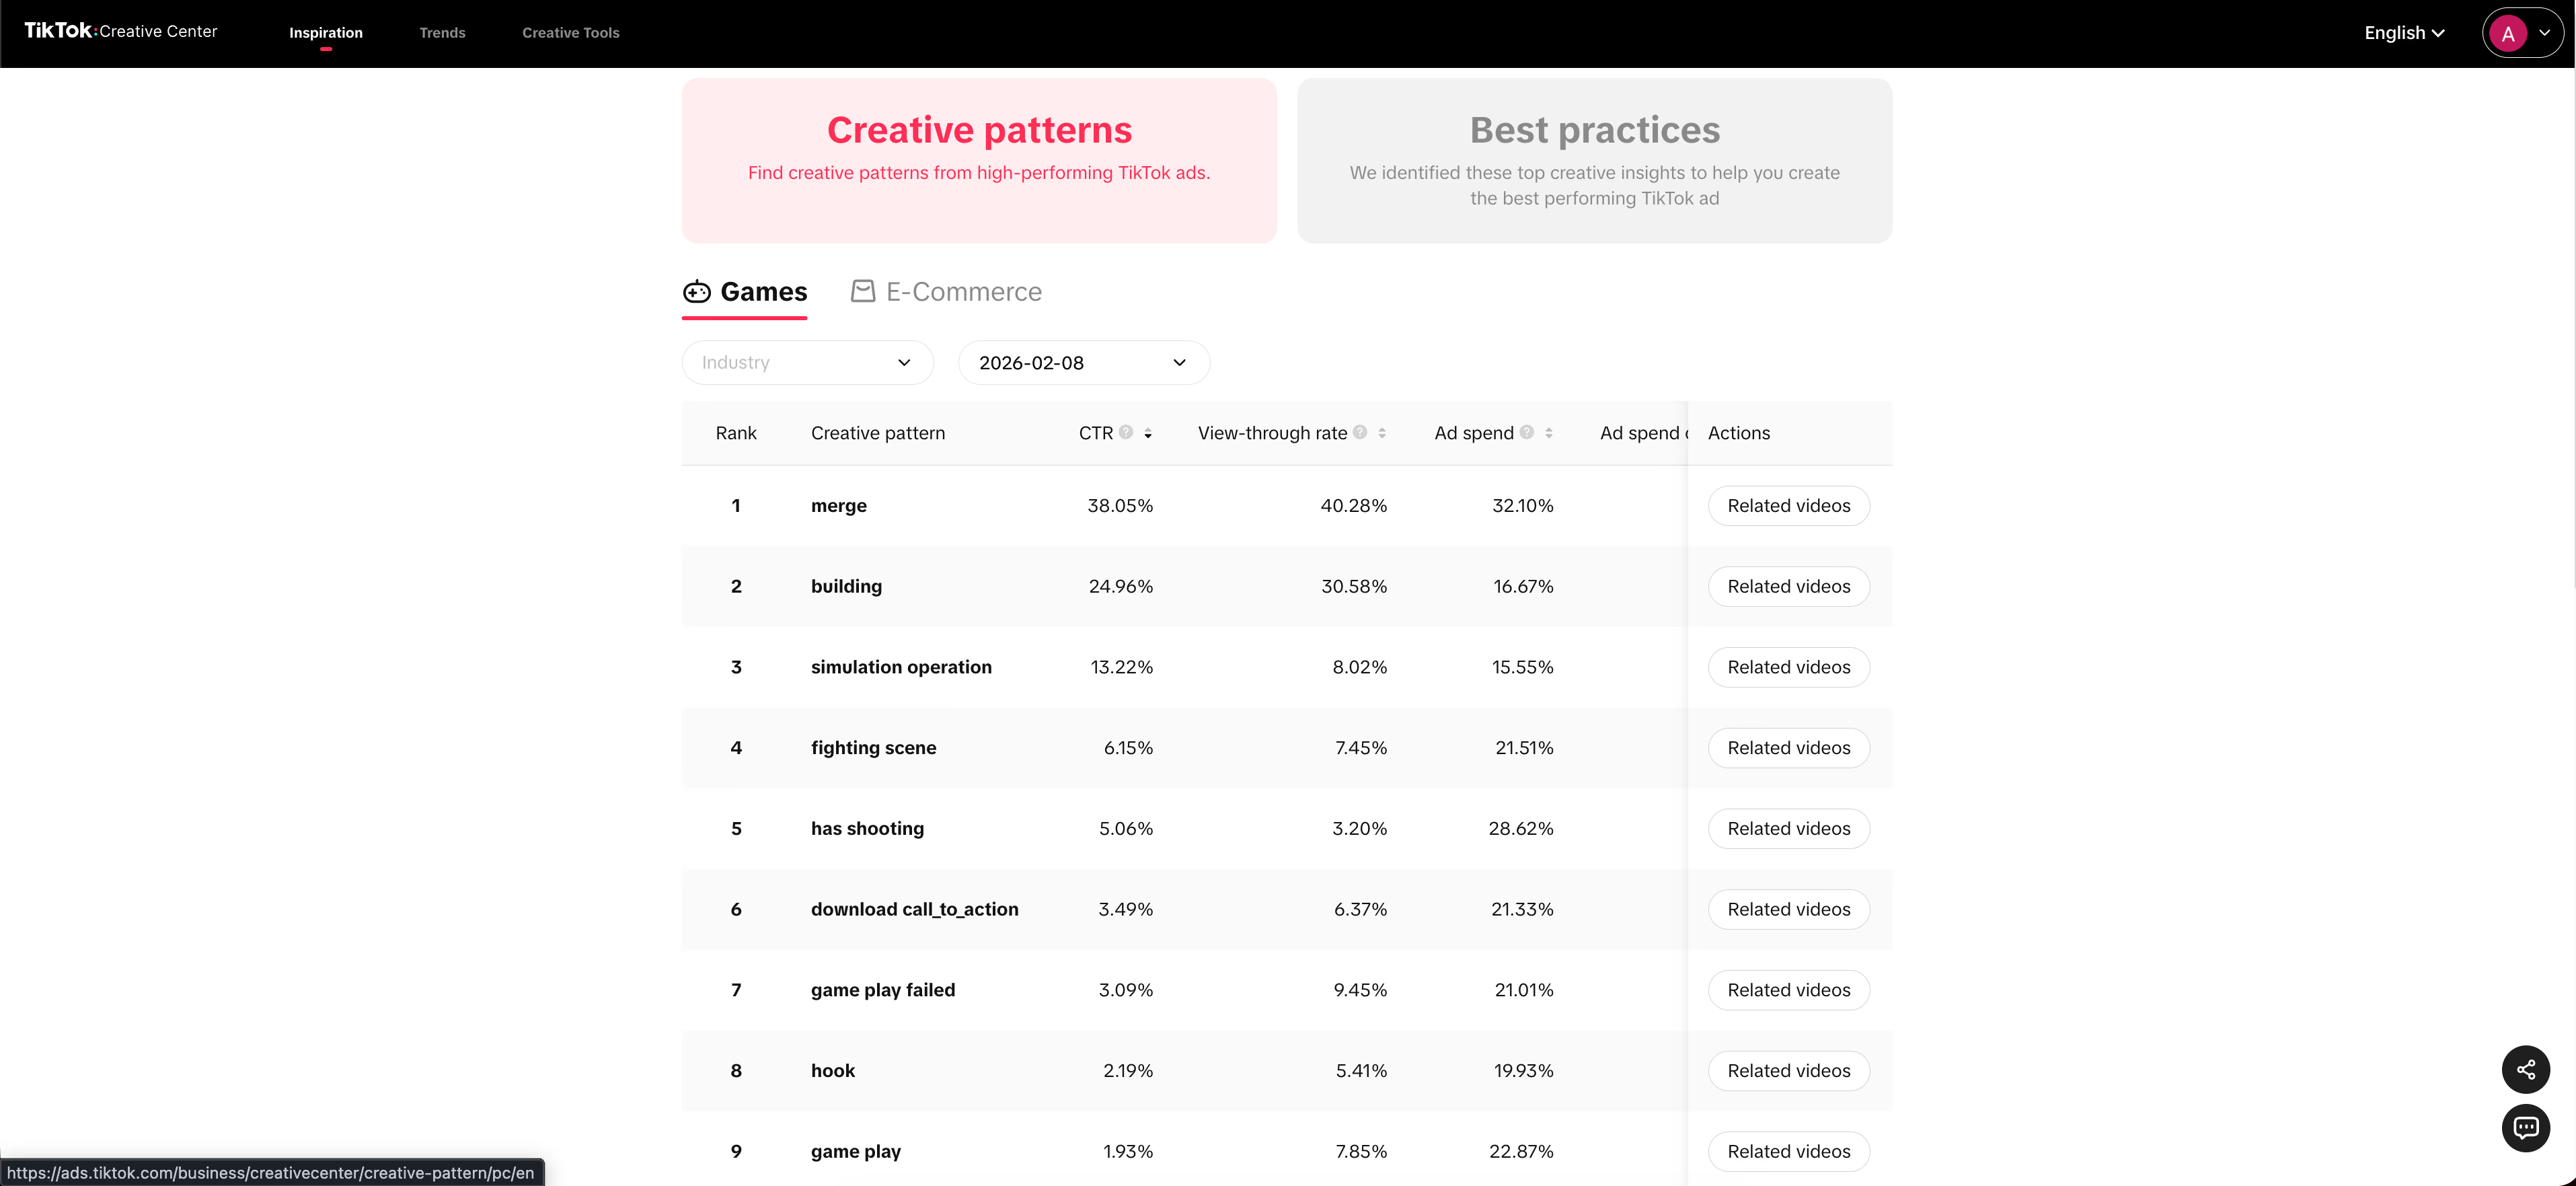
TikTok Creative Center reveals trending creative patterns as TikTok’s algorithm promotes certain formats quickly.
The problem is operational. Monitoring 10 to 30 competitors daily takes hours and can stall your workflow.
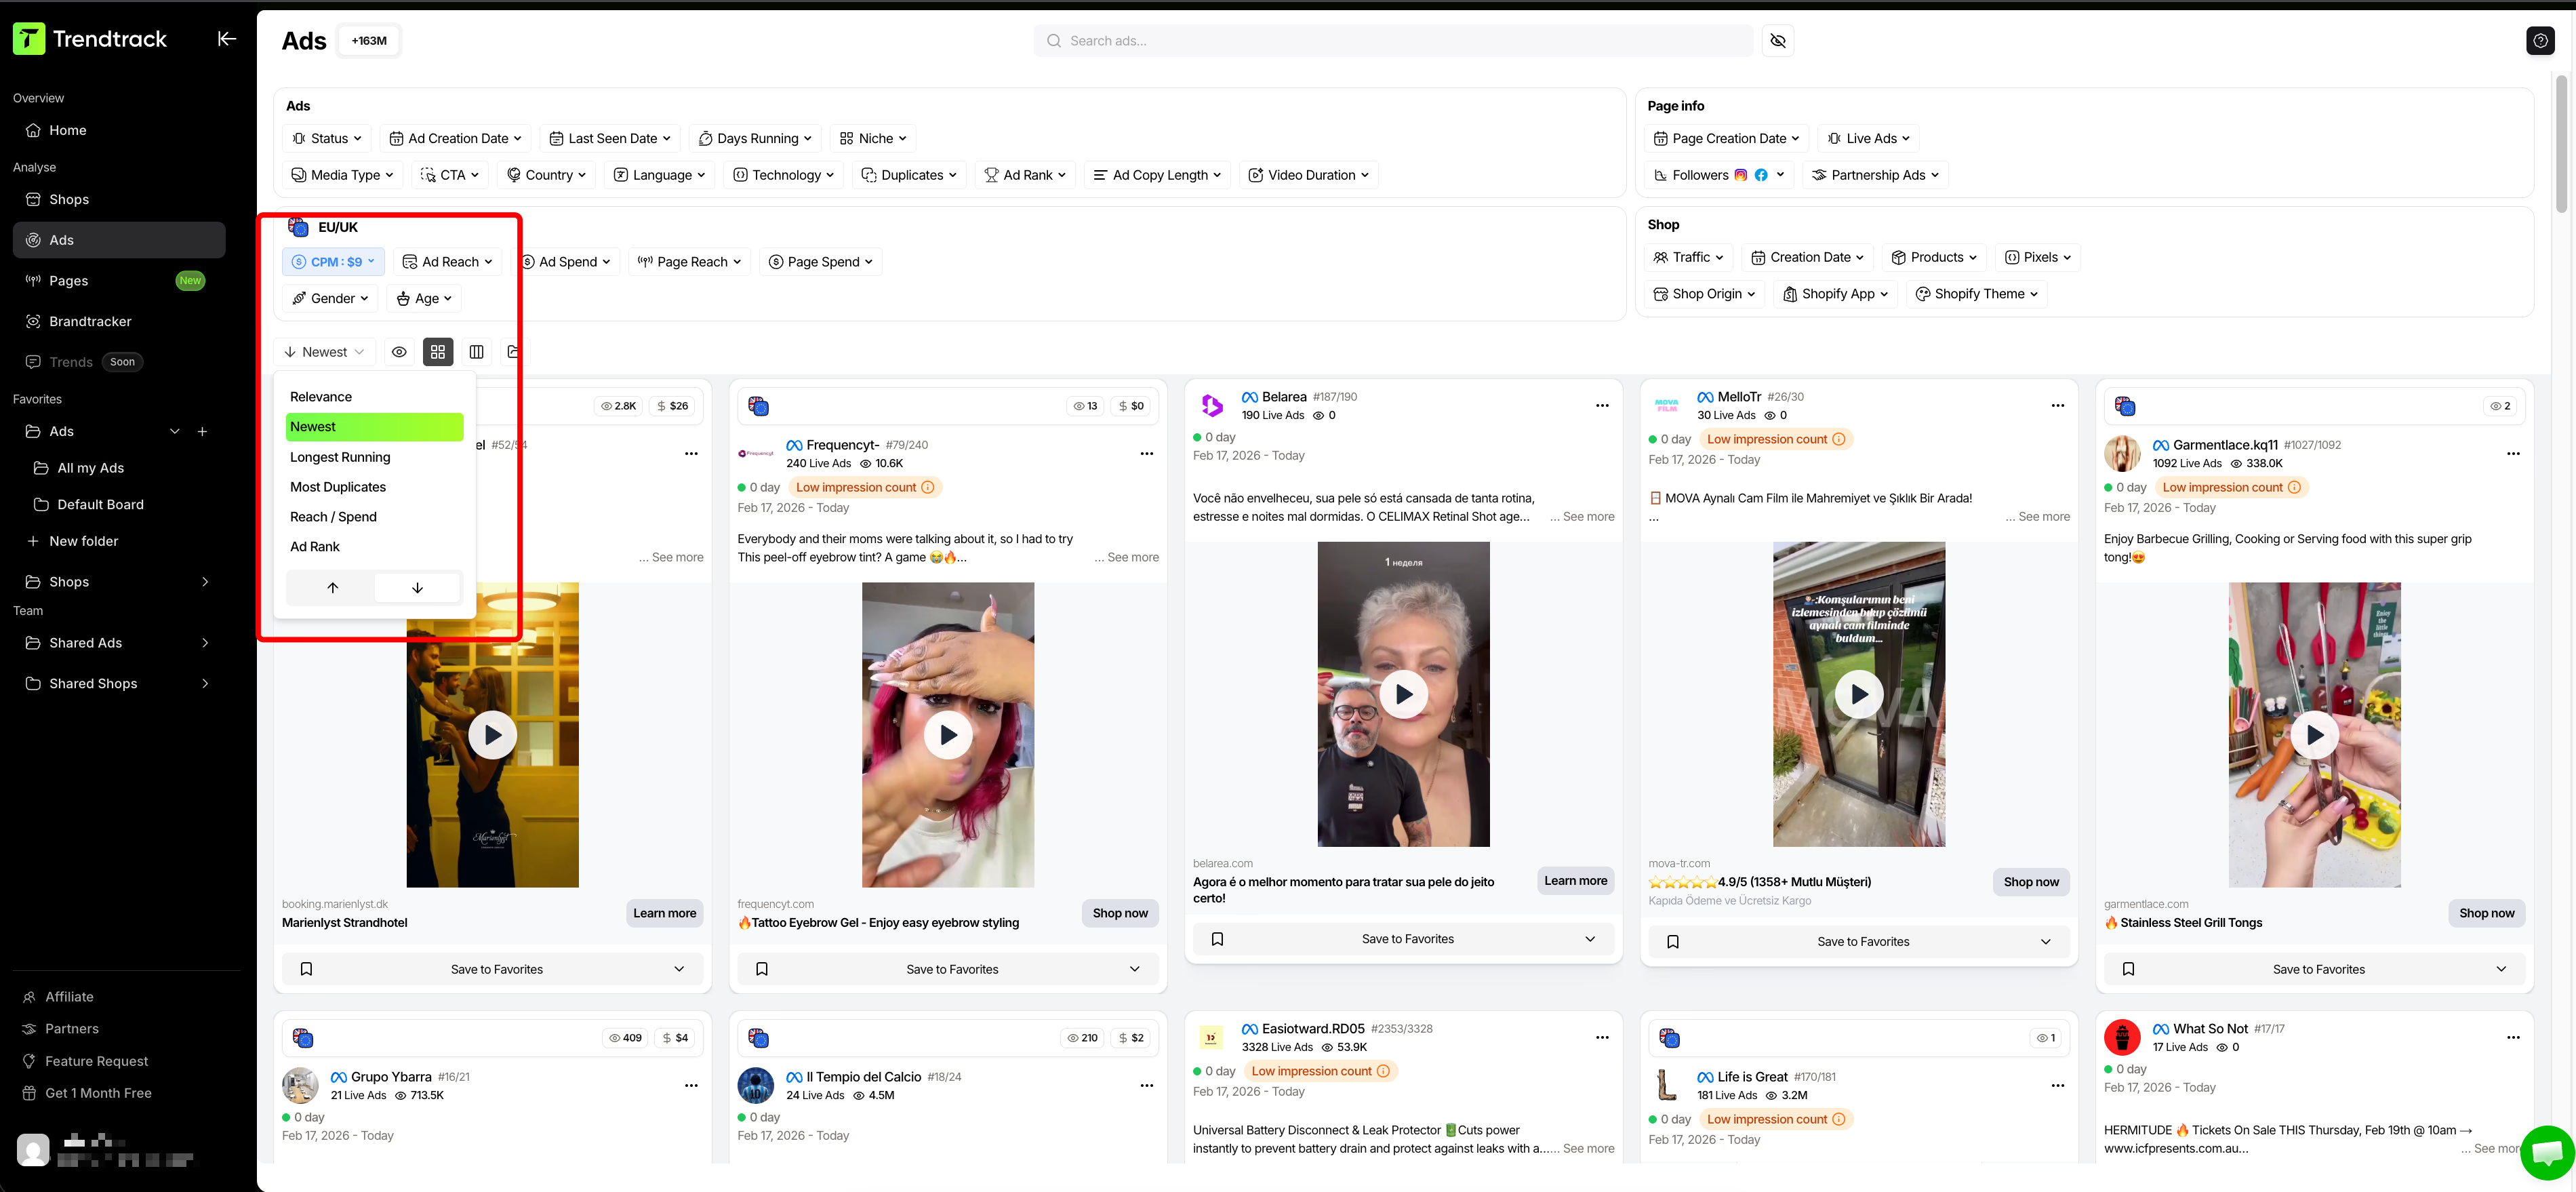
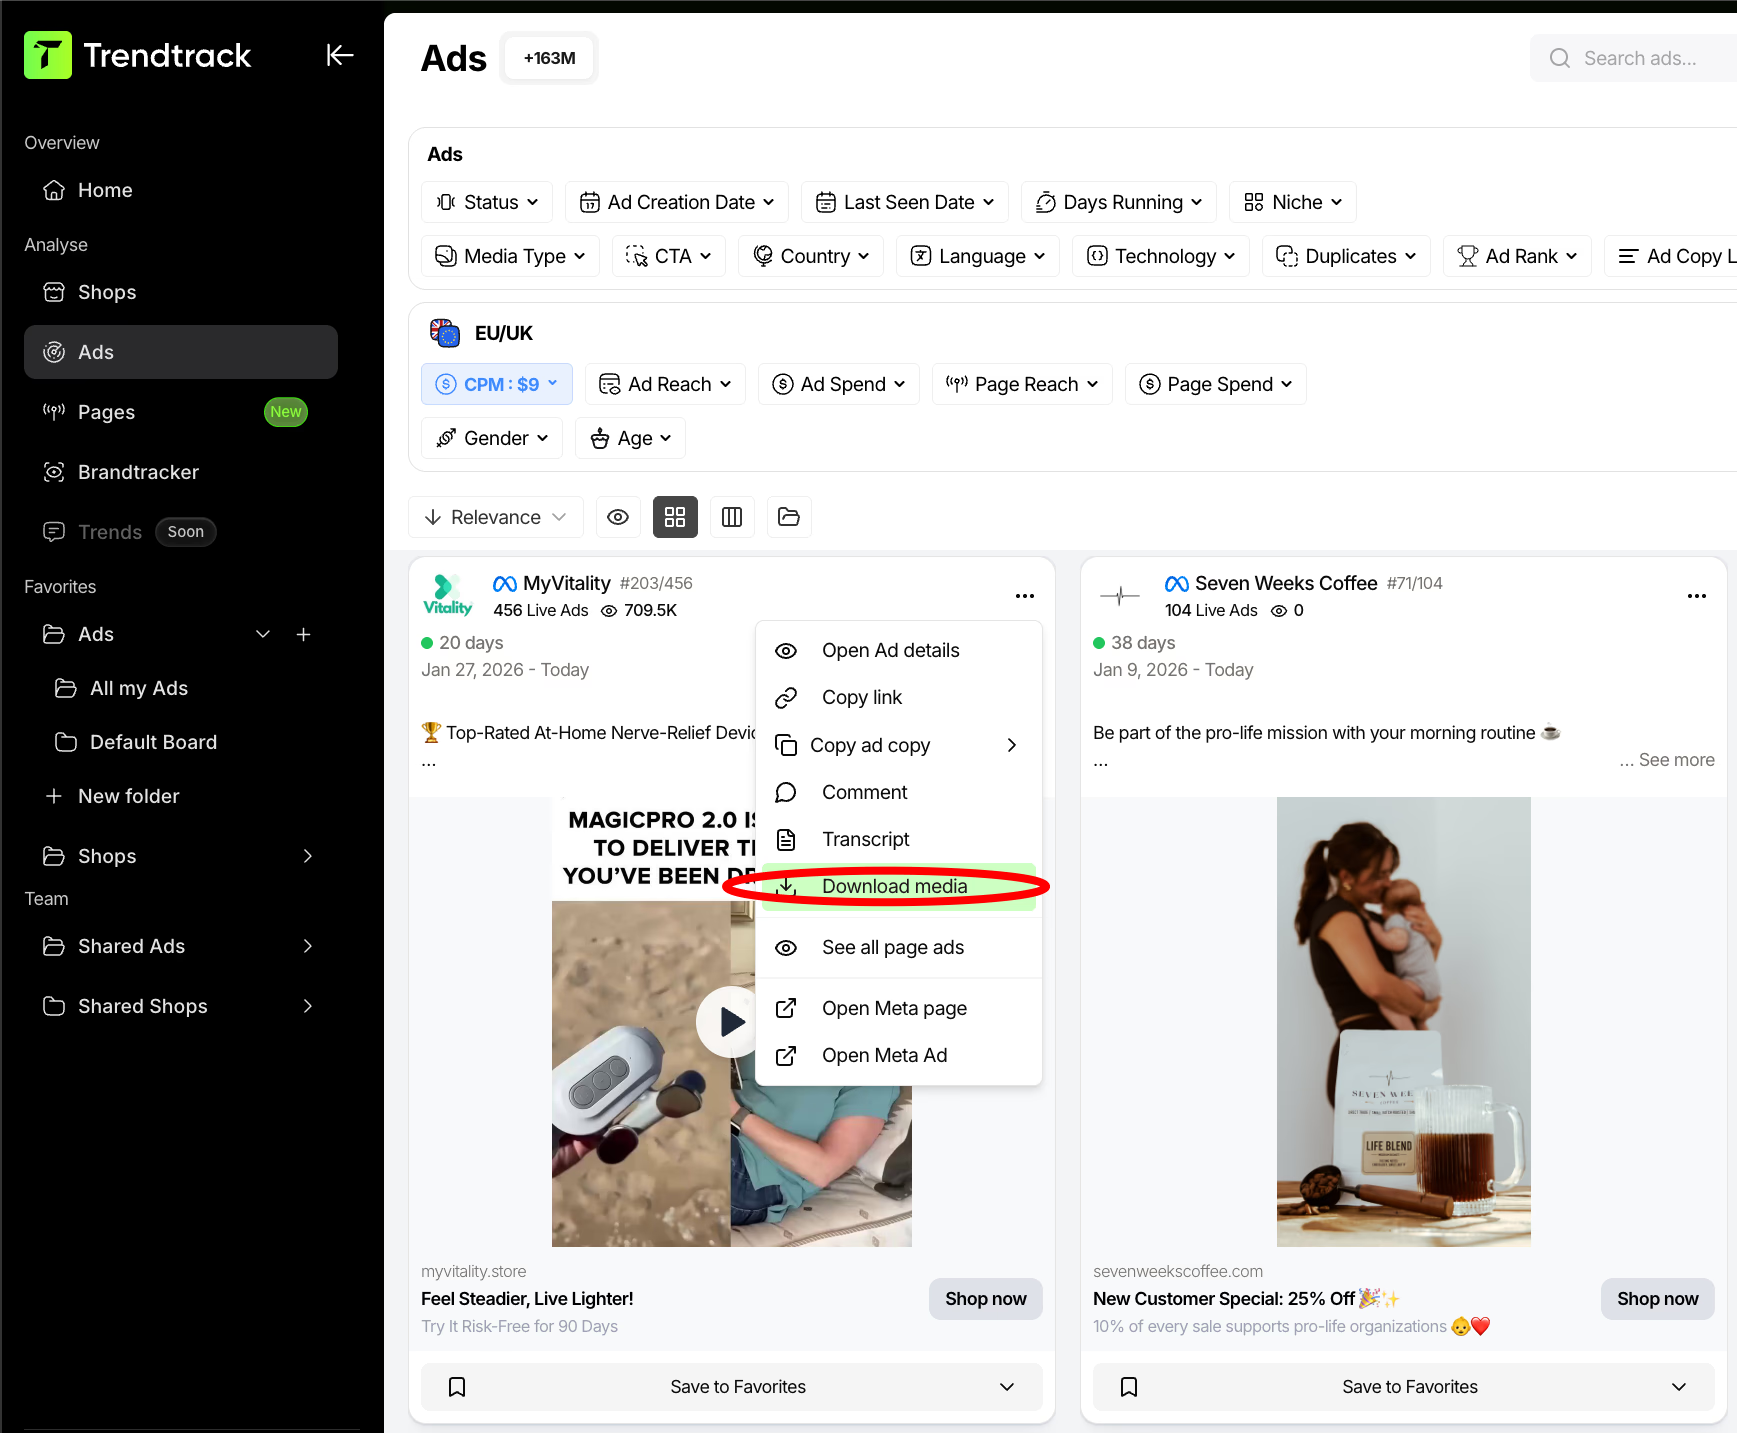
Trendtrack solves this by integrating these insights into your workflow. Use Ads tab to see which ads are gaining attention now. After that, switch to Brandtracker. You can explore a specific brand’s full ad story, including ad libraries, landing pages and more.
Instead of asking, “What is the average CPM on TikTok vs Meta?” ask:
Are brands in my category on Meta focusing on image ads, video ads, or a mix?
On TikTok, are they testing many new creative variations or sticking with a few concepts for weeks?
Is the market growing with more active ads and pages scaling, putting CPM pressure on all platforms?
You’ll stop guessing CPM and start reading demand signals.
Save Hours of Research Time
Stop checking five different tools. Trendtrack provides better insights in one platform. Save time and streamline your research workflow.

Find long-running winners
As established earlier, the era of cheap impressions is fading. So focus on ads that last, not just cheap ones. Two filters in Trendtrack's Ads section matter:
Ads running 30+ days often prove profitable instead of stopping after brief tests.
Concepts duplicated across many ads reveal what the market agrees works, even if you still need to differentiate.
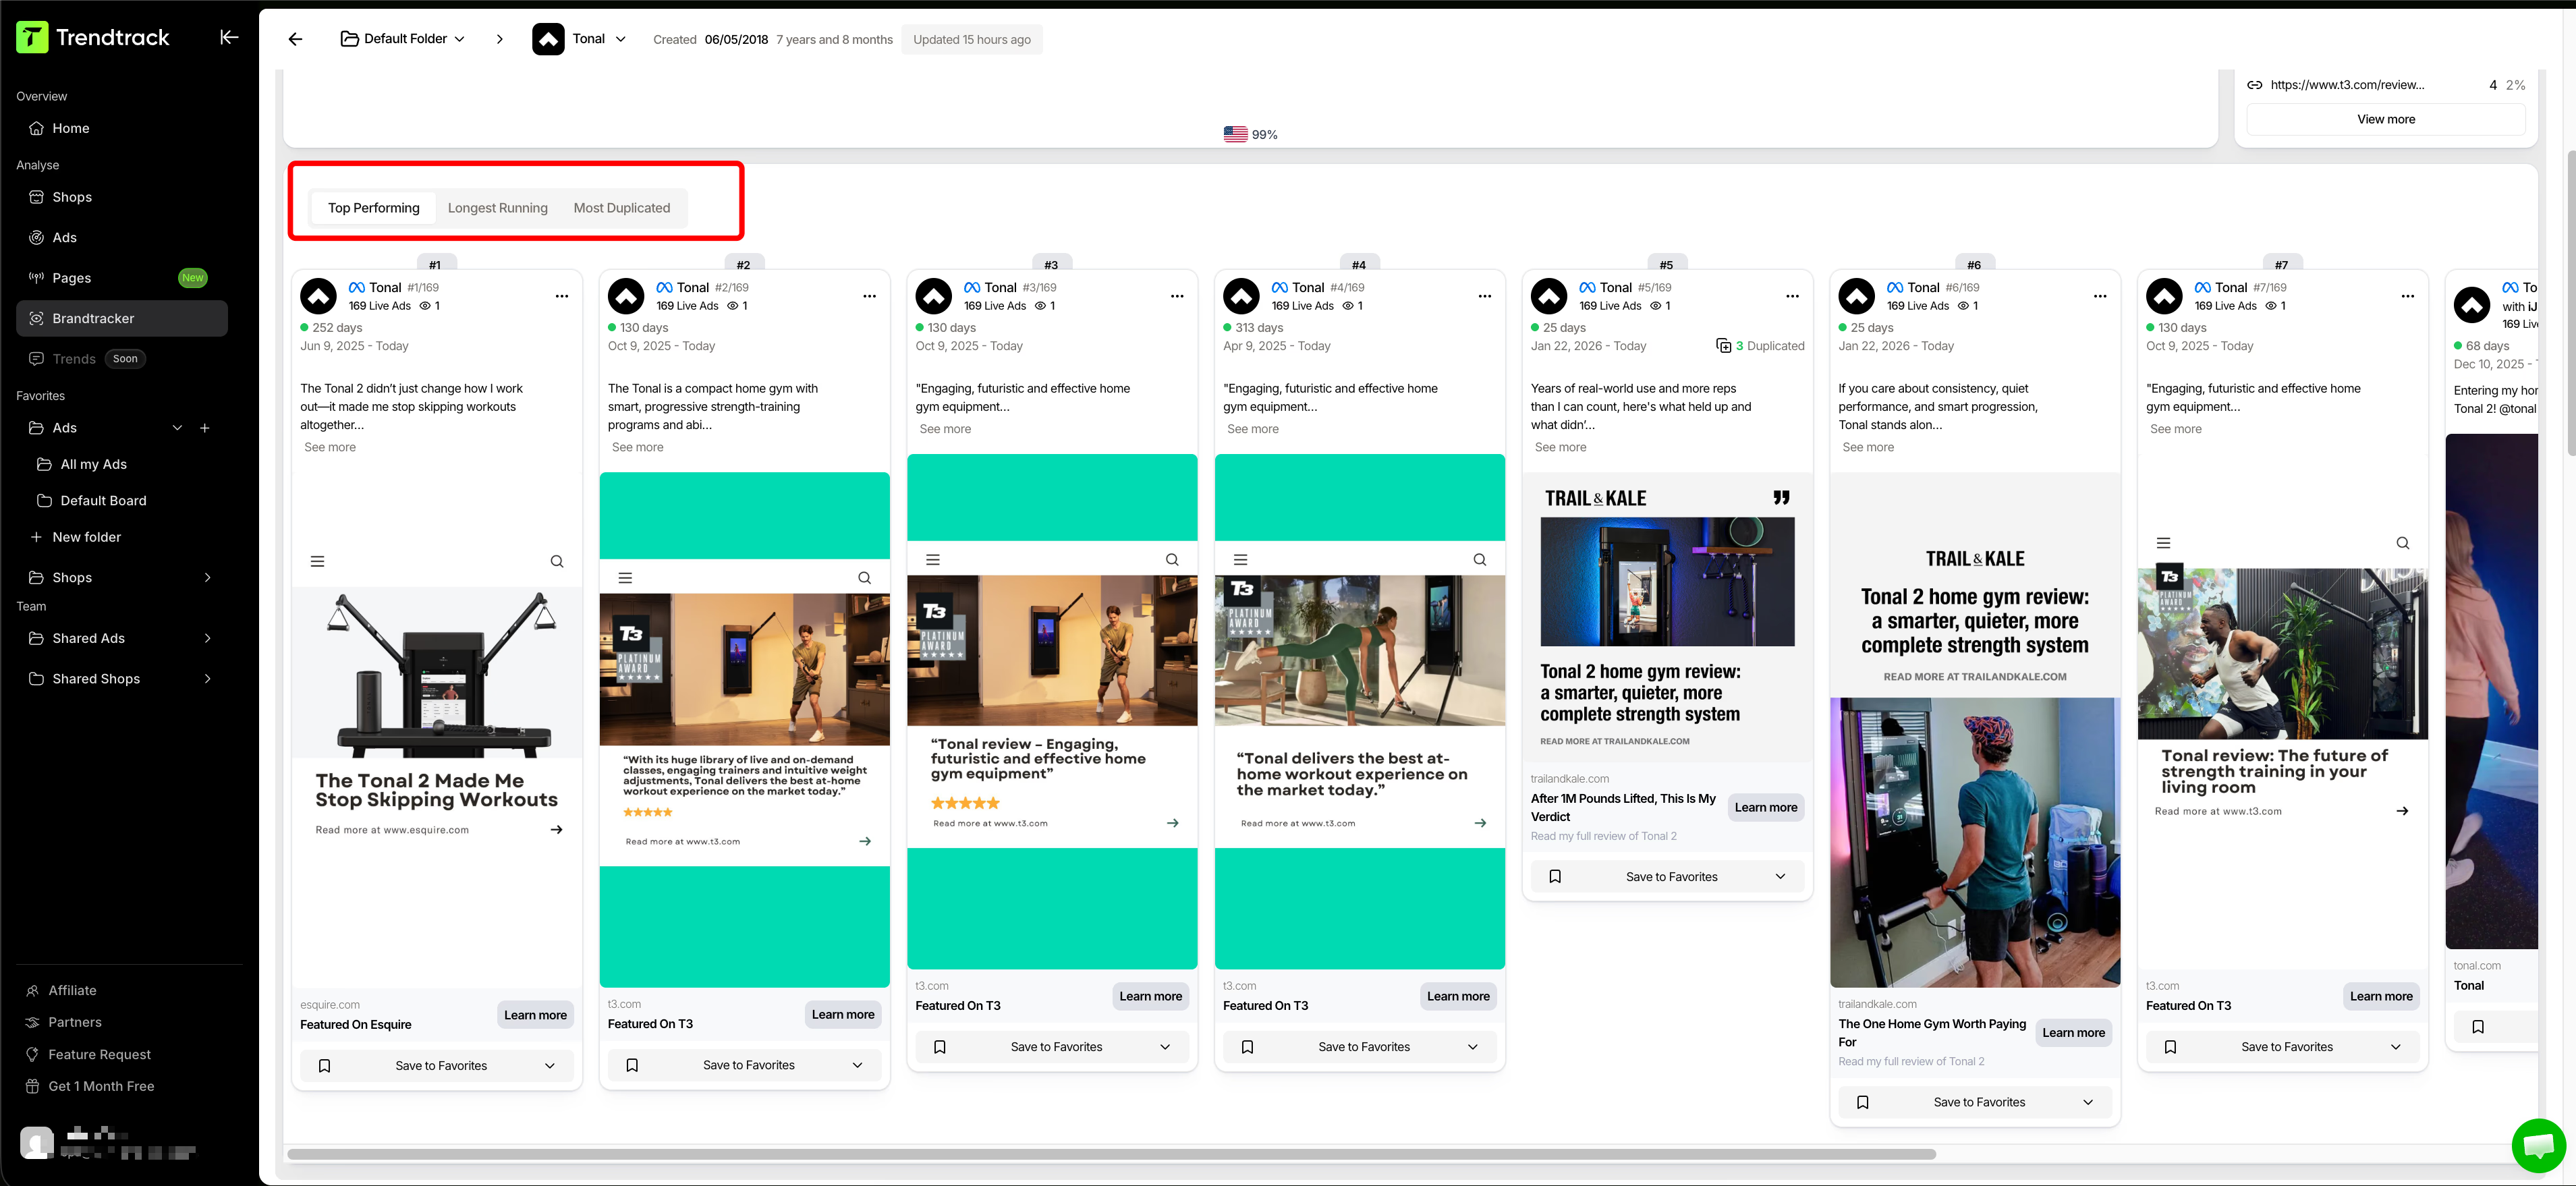
Within Brandtracker, you can dig deeper:
Review creatives, sorting by longest running or most duplicated
Analyze ad copies and headlines by usage and duration
Examine landing pages, and quickly jump from page to the ads driving traffic there
This lets you extract the repeatable logic that keeps DTC ads alive without blindly copying their ads.
For creative teams, one simple rule applies. Focus briefs on longevity, not just novelty. New isn’t a performance metric. Ads that keep running often are.
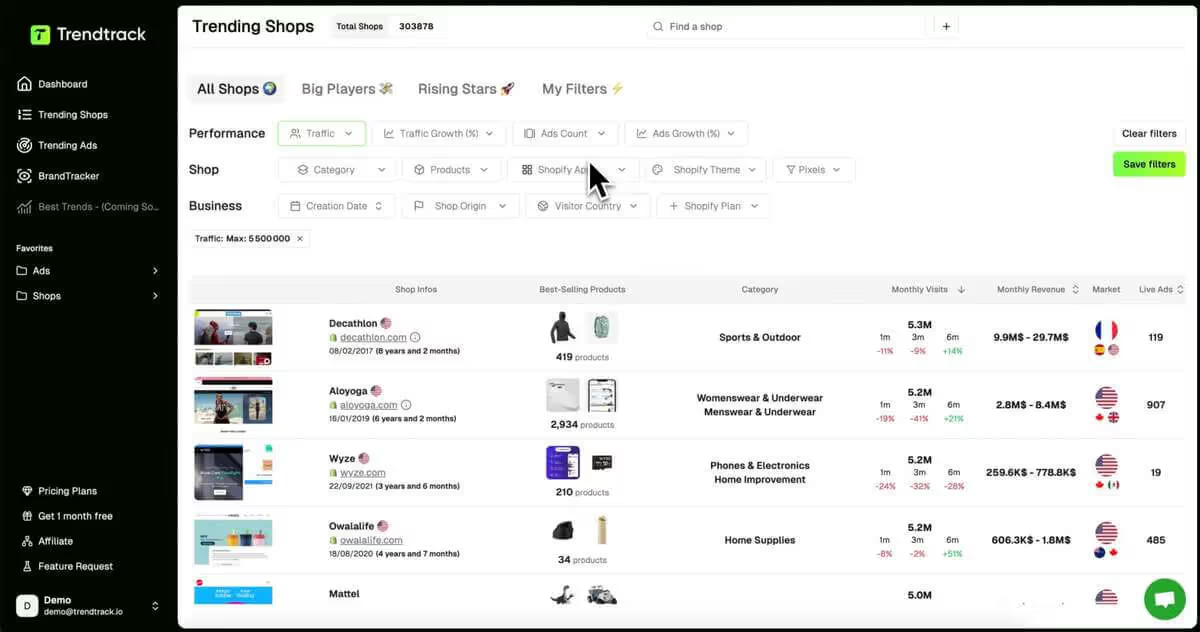
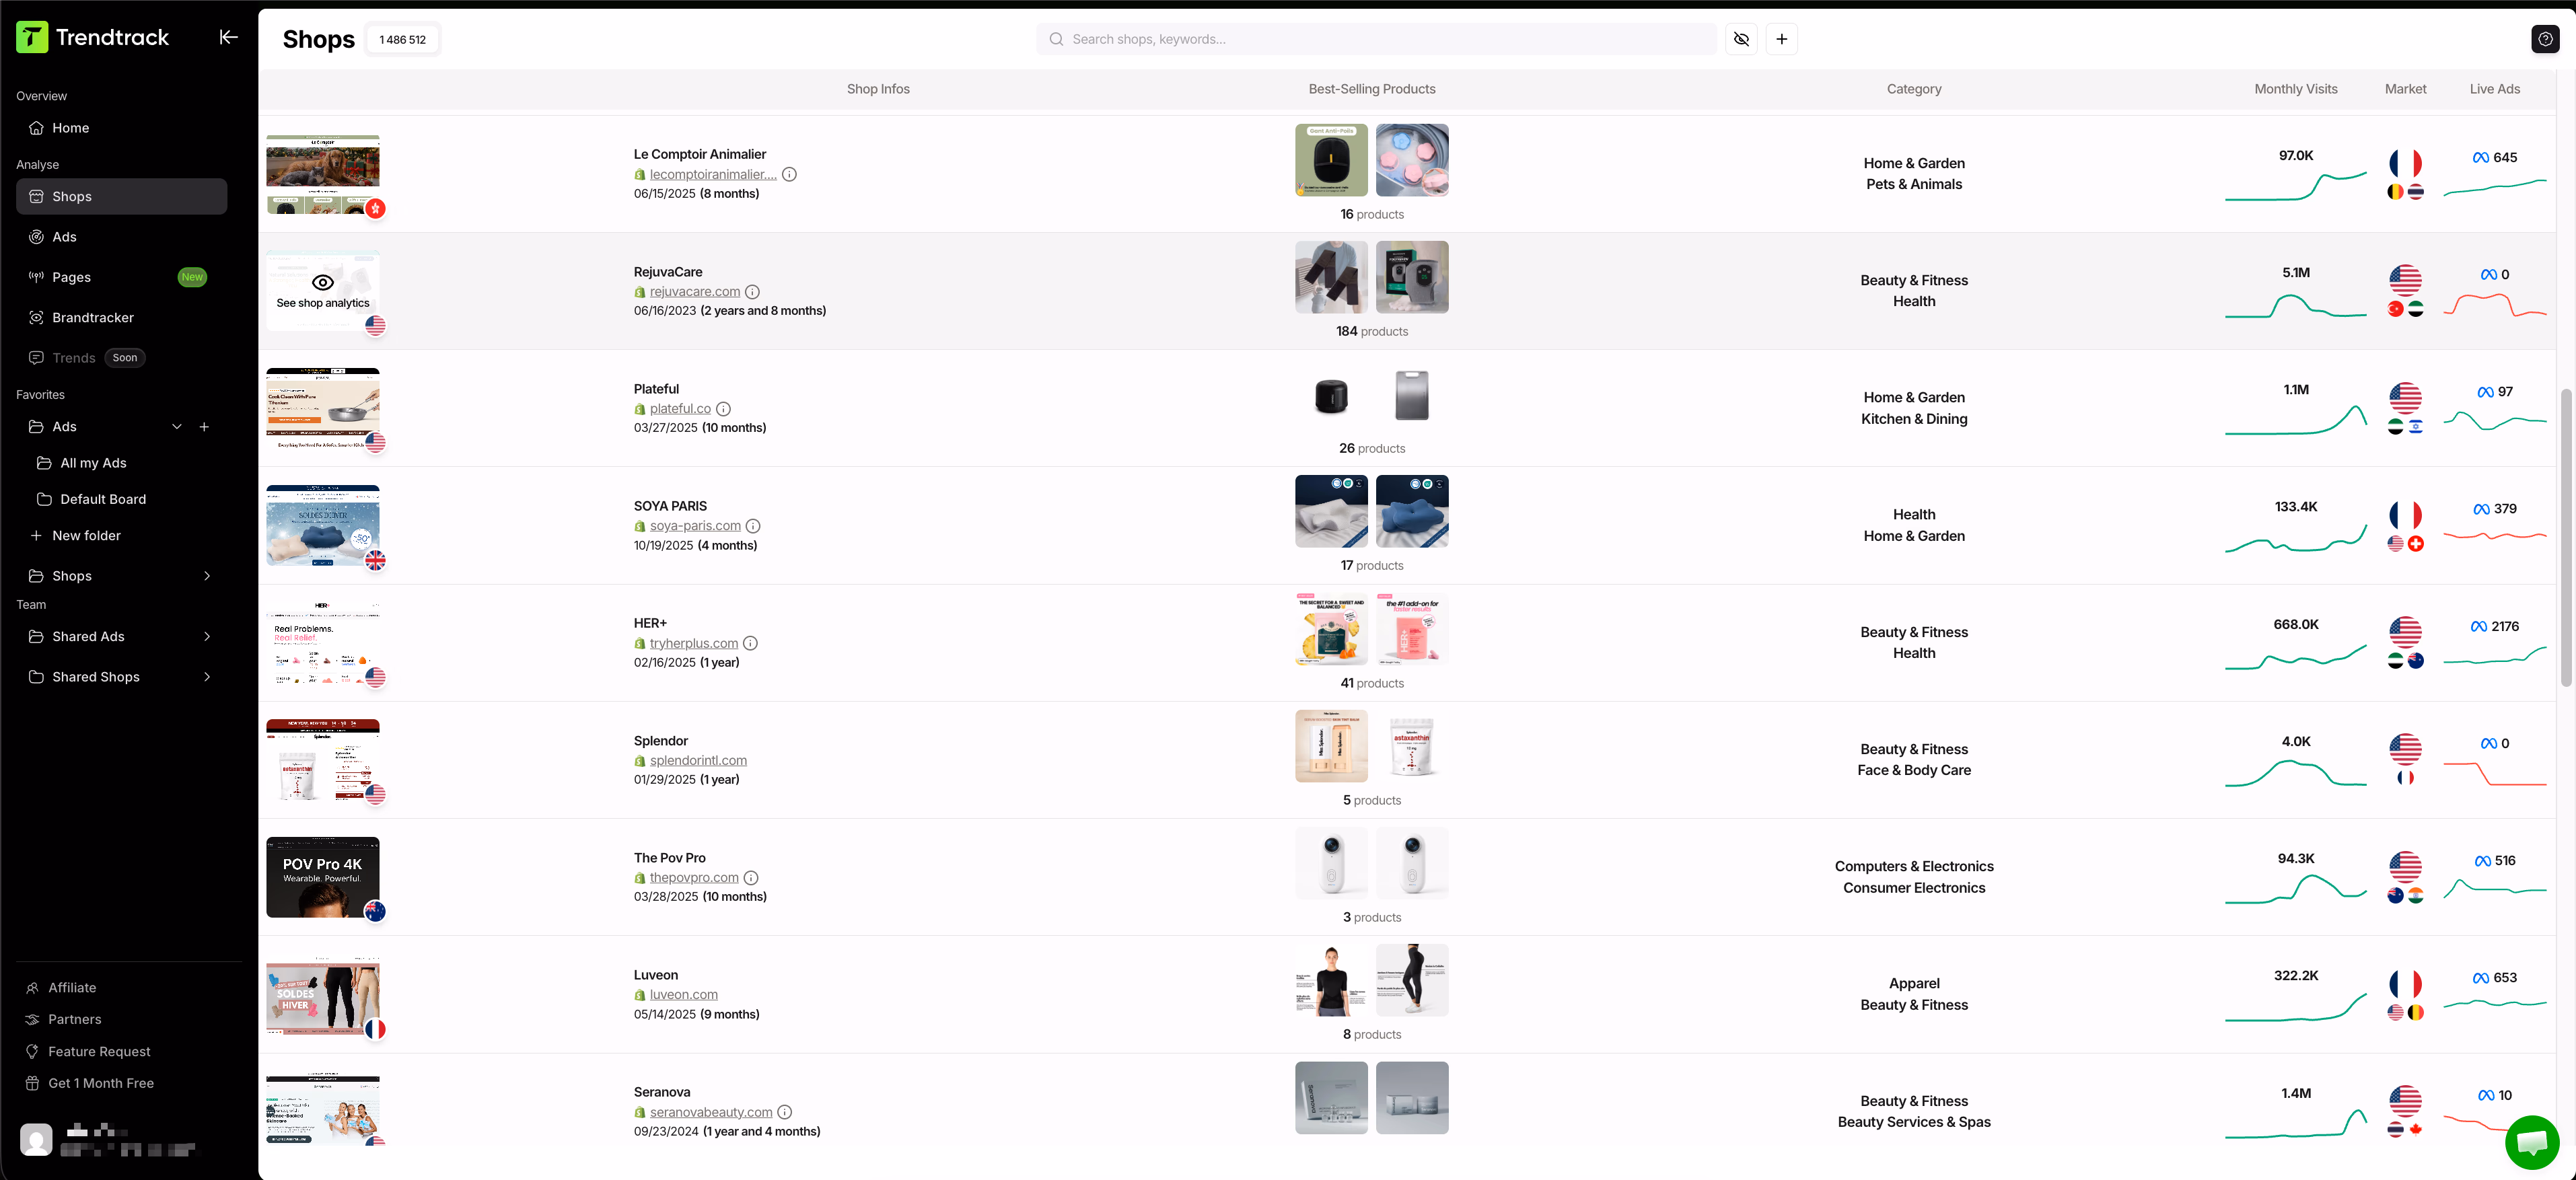
Validate competitor profitability
Even seeing ads doesn’t prove they work unless you understand demand. Trendtrack’s Shops section shows stores with data like monthly visits, category, market, and live ad count. Combining this data helps you check your CPM assumptions.
Here’s a scenario CPM debates ignore. A competitor may pay higher CPMs but still win. If their system converts clicks well through offers, landing pages, products, and upsells. You can spot this by tracking:
Steady or growing ad counts, meaning consistent ad investment
Growing traffic momentum, showing market response
Operational maturity, visible by Shopify apps, theme, and pixel usage
This separates “TikTok is cheap” from “this brand is scaling.” One is a cost figure. The other signals business success. To avoid guessing, combine these views:
Identify persistent ads with Ads, Pages section and Brandtracker
Verify store demand growth with Shops traffic data
Build a monitoring dashboard
Competitive intelligence works only if you apply it regularly. Trendtrack supports this continuous process with monitoring tools. A practical dashboard maps directly to CPM pressure and budget decisions without overwhelming you:
To spot competitors about to scale: use Shops with filters for Ads Growth and Traffic Growth (timeframe and value)
To distinguish “testing chaos” from “scaling discipline”: track Ads count averages over 7 or 30 days within Trending Shops
To find likely profitable ads: check Trending Ads for ads running 30+ days and with an Active status
To uncover market convergence on concepts: filter Trending Ads by Duplicates count
To discover underrated winners before mainstream growth. Use Ads filters for pages less than 6 months old, under 10,000 followers, and high 24-hour spend
When CPM spikes due to seasonal or competitive pressure, Trendtrack’s “Safety First” approach helps. Filter for active ads with 30+ days running to model what has survived the toughest tests.
Once you identify patterns, move quickly from insight to action. Download the creatives. This accelerates testing without wasting time.
Ultimately, the goal isn’t to know which platform has lower CPM this week. It's to build a system where your team reacts faster than competitors when CPMs change. Launch confidently with real data.
Analyze High-Performing Ads
Conclusion
TikTok vs Meta CPM isn't about finding the cheaper platform. It's about understanding what each dollar buys. TikTok delivers attention at lower entry costs, but Meta often converts that attention into revenue more efficiently.
The CPM gap is shrinking. As TikTok matures, expect both platforms to compete on outcomes, not just reach. Efficient ecommerce teams will stop chasing cheap impressions and start measuring what matters. CPA, ROAS, and net-new customer acquisition.
Use the benchmarks in this guide as a starting point, but let your own data—and competitor signals—drive your budget allocation.


.avif)


Are you ready to get the insights?
From viral trends to million-dollar stores — unlock the insights behind what sells, scales, and converts. All in one place.