Meta ad spend by industry 2025: the ultimate benchmark report


Meta reaches 3.43 billion daily active users! But a "good" CPC in fashion ($0.45) would be a disaster in finance ($3.77). Generic benchmarks hide these differences, and hiding differences costs you money.
This guide breaks down Meta ad spend benchmarks by industry for 2025—CPC, CTR, CVR, CPA, and ROAS across 18 sectors. Find your industry, compare your numbers, and calculate your real break-even point.
Why industry benchmarks are critical for your media planning
Global averages can be misleading. These numbers hide large differences between sectors. Benchmarks help you determine if your campaigns are effective or just maintaining presence.
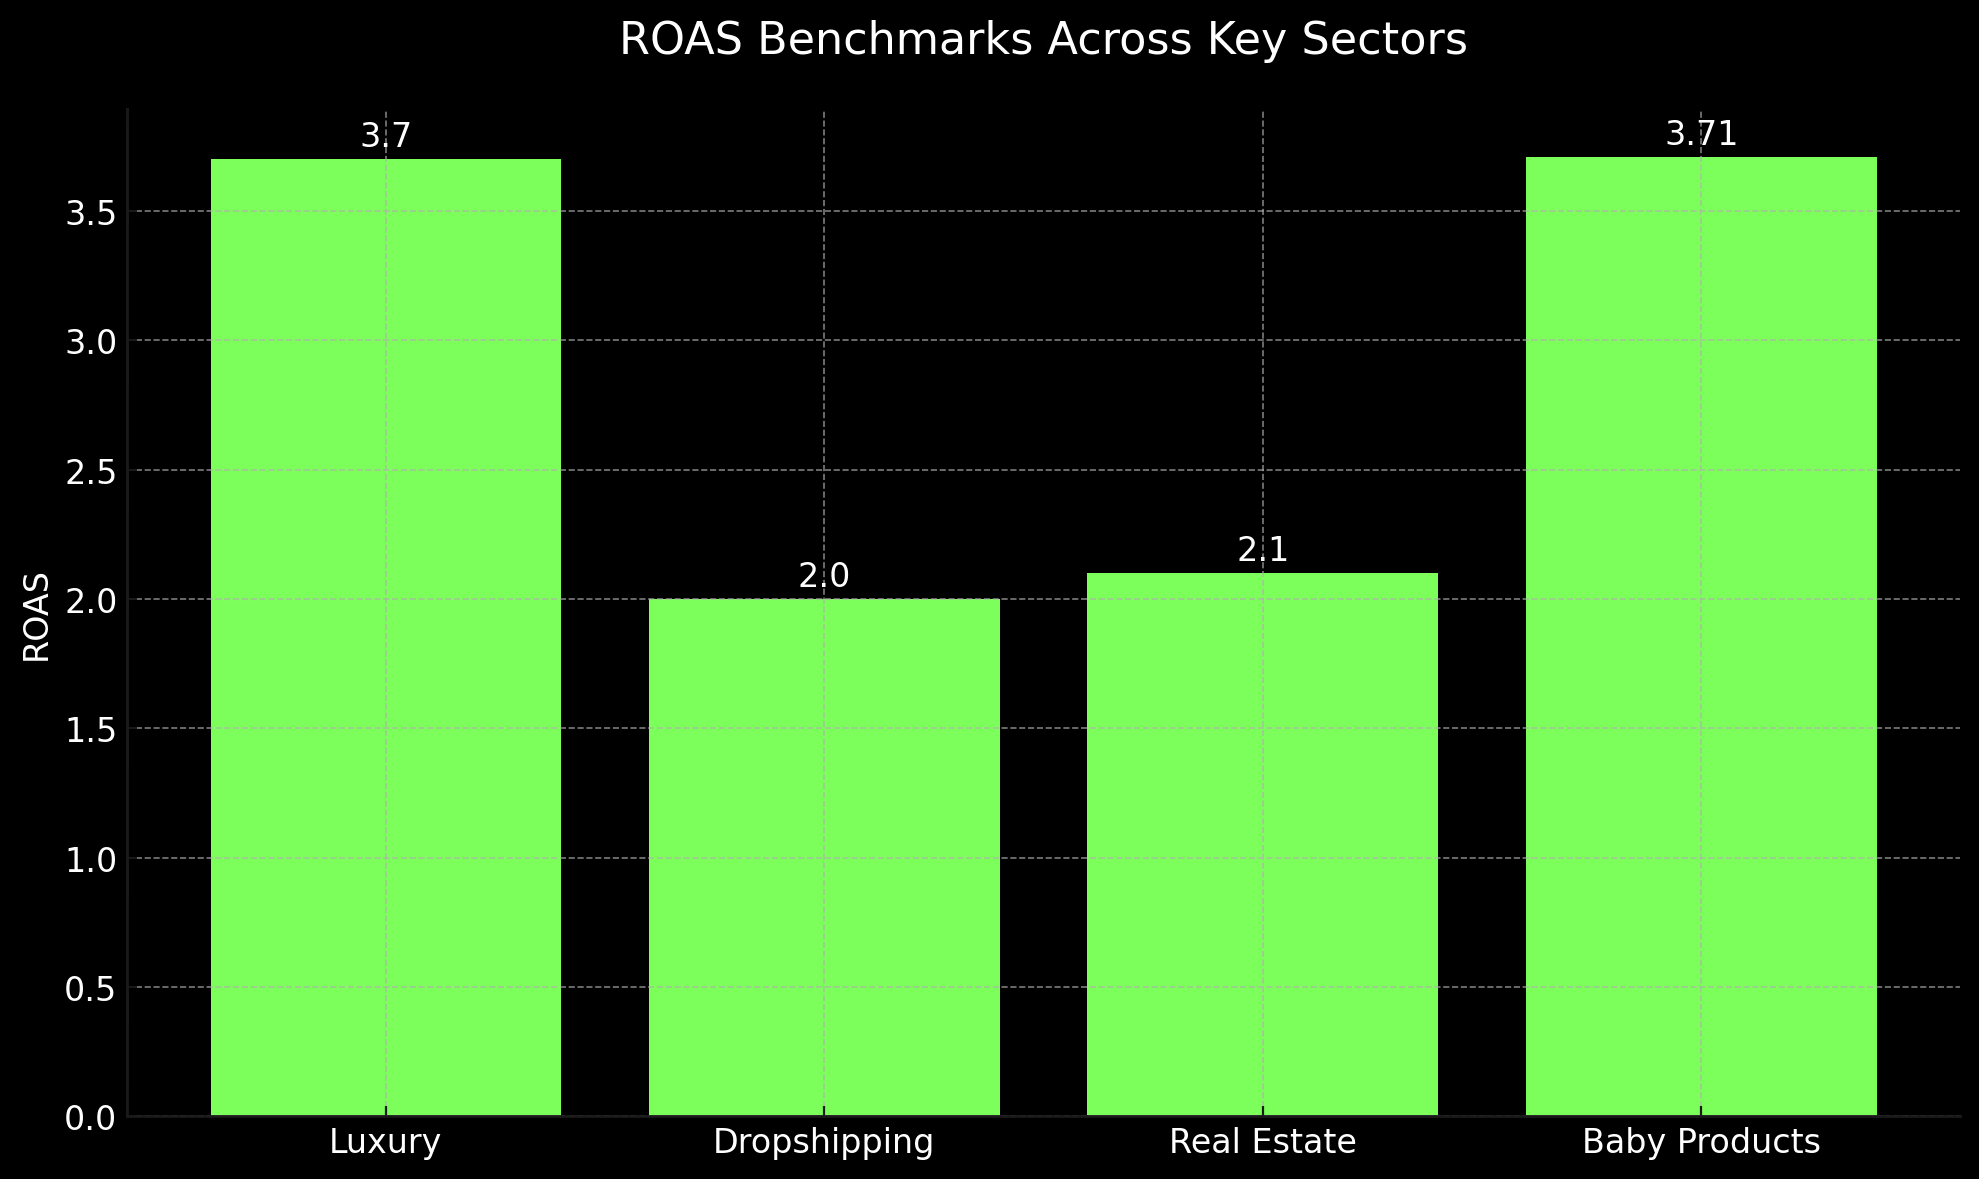
Consider the differences in key sectors:
Luxury brands achieve about 3.7:1 ROAS due to larger margins
Dropshipping operates around 2.0:1 because of thin margins
Real estate lead generation averages 2.1:1 with longer payoffs
Baby products reach roughly 3.71:1 because of impulse buying
Benchmarks serve as baselines, not goals. If finance campaigns typically perform near 3.50:1 and your campaigns fall short, you're losing to competitors. Because they have mastered lifetime value. Use the right baseline to evaluate your efforts instead of guessing.
Global ad spend trends and the shift toward AI-driven campaigns
Manual controls are giving way to automation. Over 4 million advertisers now use Meta’s generative AI for creating images, videos, and text.
Advantage+ shopping campaigns reached over $20 billion annual run-rate by late 2024, a 70% increase year-over-year. Brands increasingly trust algorithms to find buyers.
The advantage no longer lies in micro-segmentation. Instead, success depends on providing the algorithm with high-quality, diverse creative assets. Rapid creation and variety keep CPMs stable, while AI finds opportunities across auctions.
To outperform competitors, focus on creative velocity and variety. Take inspiration from the biggest direct-to-consumer (DTC) brands.
The impact of economic factors on CPM and CPC in 2025
Meta plans to spend between $64 billion and $72 billion in 2025 on AI and data centers. This investment increases operational costs and drives ad prices higher. Essentially, advertisers pay for the infrastructure that supports their ads.
ROAS tends to vary seasonally:
January and February typically see drops to 1.8–2.2:1
The fourth quarter can spike ROAS to around 5:1 despite higher CPMs in November and December
Signal loss from iOS, estimated at 20–30%, inflates apparent CPCs by hiding cheaper conversions. This acts as an "invisible tax" on attribution.
Profitability no longer depends on a single bid but on navigating a crowded, costly, AI-managed auction. Launch campaigns with confidence, based on real data. Focus your spend and creative efforts where the algorithm can generate real win. Instead of wasting hours scrolling without results.
Key performance metrics and benchmarks by industry
Below are the core metrics you’ll use to judge performance. CPC, CTR, CVR, CPA, and 2025 ROAS. Compare your dashboard to these sector-level baselines to decide if you are optimizing or just paying to play.
CPC (Cost Per Click): How much you pay every time someone clicks your ad.
CTR (Click-Through Rate): The percentage of people who clicked after seeing the ad.
CVR (Conversion Rate): The percentage of clicks that turned into a desired action (purchase, signup, etc.)
CPA (Cost Per Acquisition): How much it costs to acquire a customer or conversion.
2025 Meta ad benchmarks by industry: the complete table
The table below consolidates CPC, CTR, CVR, CPA, and ROAS benchmarks across 18 industries. Use it as your single reference point to evaluate campaign performance against sector-specific baselines—not generic averages that hide critical differences.
Industry | Avg. CPC | Avg. CTR | Avg. CVR | Avg. CPA | Avg. ROAS | Key Insight |
|---|---|---|---|---|---|---|
Apparel | $0.45 | 1.24% | 4.11% | $10.98 | 2.30:1 | Lowest CPC; rotate creatives frequently |
Auto | $2.24 | 0.80% | 5.11% | $43.84 | 2.50:1 | High CPA justified by large ticket size |
B2B | $2.52 | 0.78% | 10.63% | $23.77 | LTV-based | Measure CPQL, not immediate ROAS |
Beauty & Cosmetics | $1.81 | 1.16% | 7.10% | $25.49 | 3.00:1+ | High CVR; UGC before/after ads excel |
Consumer Services | $3.08 | 0.62% | 9.96% | $31.11 | 2.60:1 | Trust signals critical for conversions |
Education | $1.06 | 0.73% | 13.58% | $7.85 | 3.20:1 | Lowest CPA; targets younger audience |
Employment & Job Training | $2.72 | 0.47% | 11.73% | $23.24 | 2.40:1 | Lowest CTR; consider LinkedIn instead |
Finance & Insurance | $3.77 | 0.56% | 9.09% | $41.43 | 3.50:1 | Highest CPC; LTV justifies the spend |
Fitness | $1.90 | 1.01% | 14.29% | $13.29 | 3.10:1 | Highest CVR; urgency-driven buyers |
Healthcare | $1.32 | 0.83% | 11.00% | $12.31 | 2.82:1 | Pre-qualify in ad copy (no retargeting) |
Home Improvement | $2.93 | 0.70% | 6.56% | $44.66 | 2.65:1 | Mix of impulse + considered purchases |
Industrial Services | $2.14 | 0.71% | 0.71% | $38.21 | 2.20:1 | Long B2B cycles; nurture required |
Legal | $1.32 | 1.61% | 5.60% | $28.70 | 3.40:1 | Highest CTR; high-value offers stand out |
Real Estate | $1.81 | 0.99% | 10.68% | $16.92 | 2.10:1 | Lead gen ads; offline follow-up critical |
Retail | $0.70 | 1.59% | 3.26% | $21.47 | 2.19:1 | DPA retargeting essential for ROAS |
Technology & SaaS | $1.27 | 1.04% | 2.31% | $55.21 | 2.8–4.2:1 | Highest CPA; optimize for registrations |
Travel & Hospitality | $0.63 | 0.90% | 2.82% | $22.50 | Seasonal | Build retargeting pools in Q1/Q2 |
Baby Products | $1.50 | 1.10% | 8.50% | $17.65 | 3.71:1 | Impulse + repeat purchases drive ROAS |
Global averages (all industries): CTR 0.90% | CPC $1.72 | CVR 9.21% | CPA $18.68 | ROAS 2.19:1
Data sources: WordStream, Triple Whale, Madgicx, and proprietary 2025 benchmarks. Figures represent median values to exclude outliers.
Average CPC, CTR, CVR, and CPA across all sectors
City-wide averages help you benchmark your campaigns. If you deviate significantly from these numbers without a clear reason, you likely waste ad dollars. A 2.19:1 ROAS may still be unprofitable depending on margins and shipping costs.
Metric | Global Average | Highest Industry | Value | Lowest Industry | Value |
|---|---|---|---|---|---|
CTR (Click-through rate) | 0.90% | Legal | 1.61% | Employment | 0.47% |
CPC (Cost per click) | $1.72 | Finance | $3.77 | Apparel | $0.45 |
CVR (Conversion rate) | 9.21% | Fitness | 14.29% | Technology | 2.31% |
CPA (Cost per acquisition) | $18.68 | Technology | $55.21 | Education | $7.85 |
If your CPA is below $18.68, you outperform the street average, but context matters. For example, a $20 CPA is poor for a $20 product but excellent for a $50,000 contract. Benchmarking with context helps you stay ahead of competitors.
Ecommerce and retail benchmarks: analyzing high-volume, low-margin spend
Retail is a high-volume game. Because average order values are often lower than B2B or Luxury, you cannot afford high CPMs. Success depends on high CTRs and maximizing cart value.
Fashion & Apparel
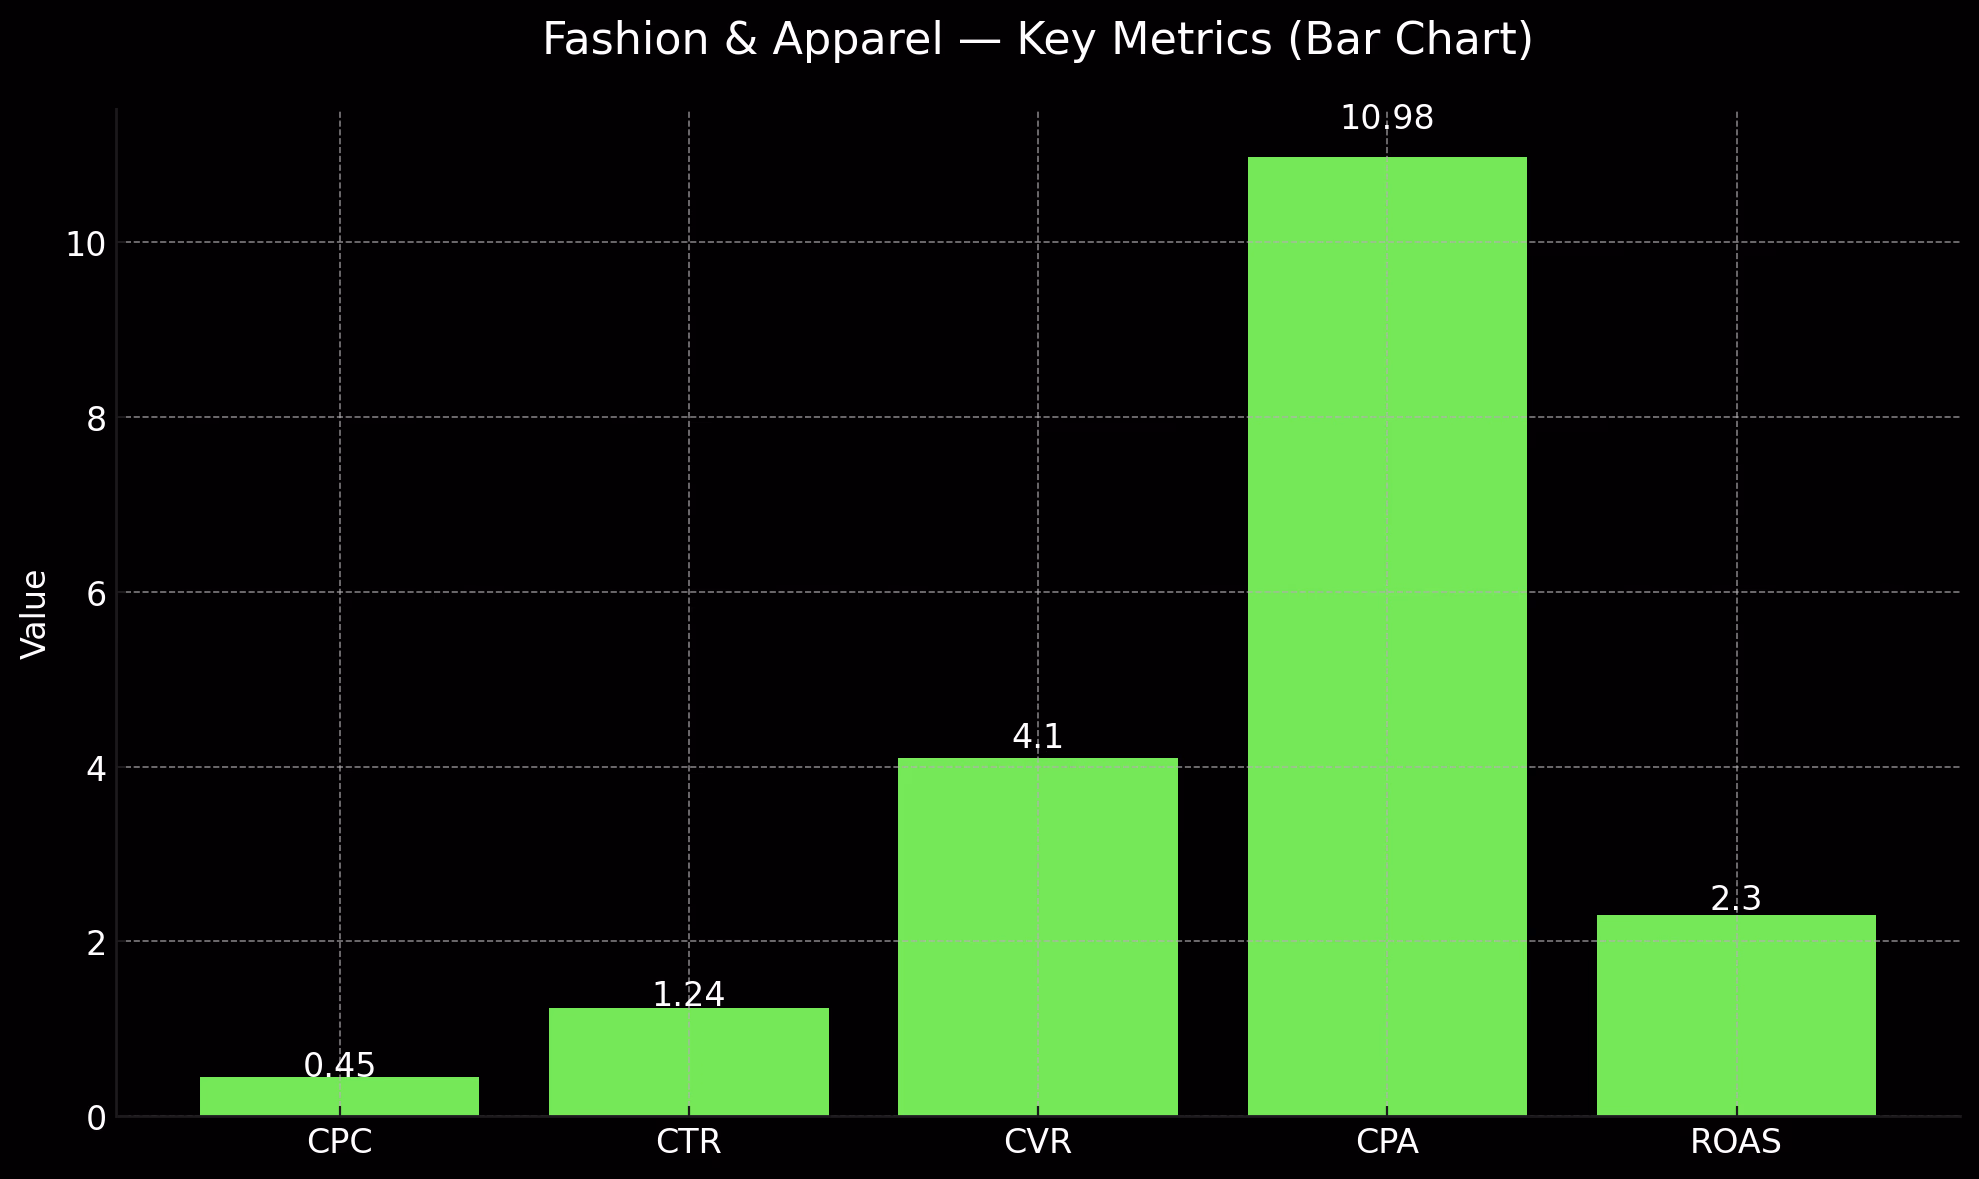
CPC ($0.45): Extremely low. The algorithm easily identifies clothing shoppers.
CTR (1.24%): High. Visually native content on Instagram/Facebook drives cheap traffic.
CVR (4.10%): Moderate. Users browse heavily but often delay purchasing.
CPA ($10.98): Low. You acquire customers cheaply, but margins are thin.
ROAS (2.30:1): Tight. Fierce competition caps your returns.
Strategy: Volume & Velocity. Ad fatigue hits fast here. Rotate creatives daily to keep CPCs low. You need high traffic volume to make the math work.
Ad fatigue is when performance drops because people have seen the same ad too many times and stop paying attention.
Beauty & Skincare
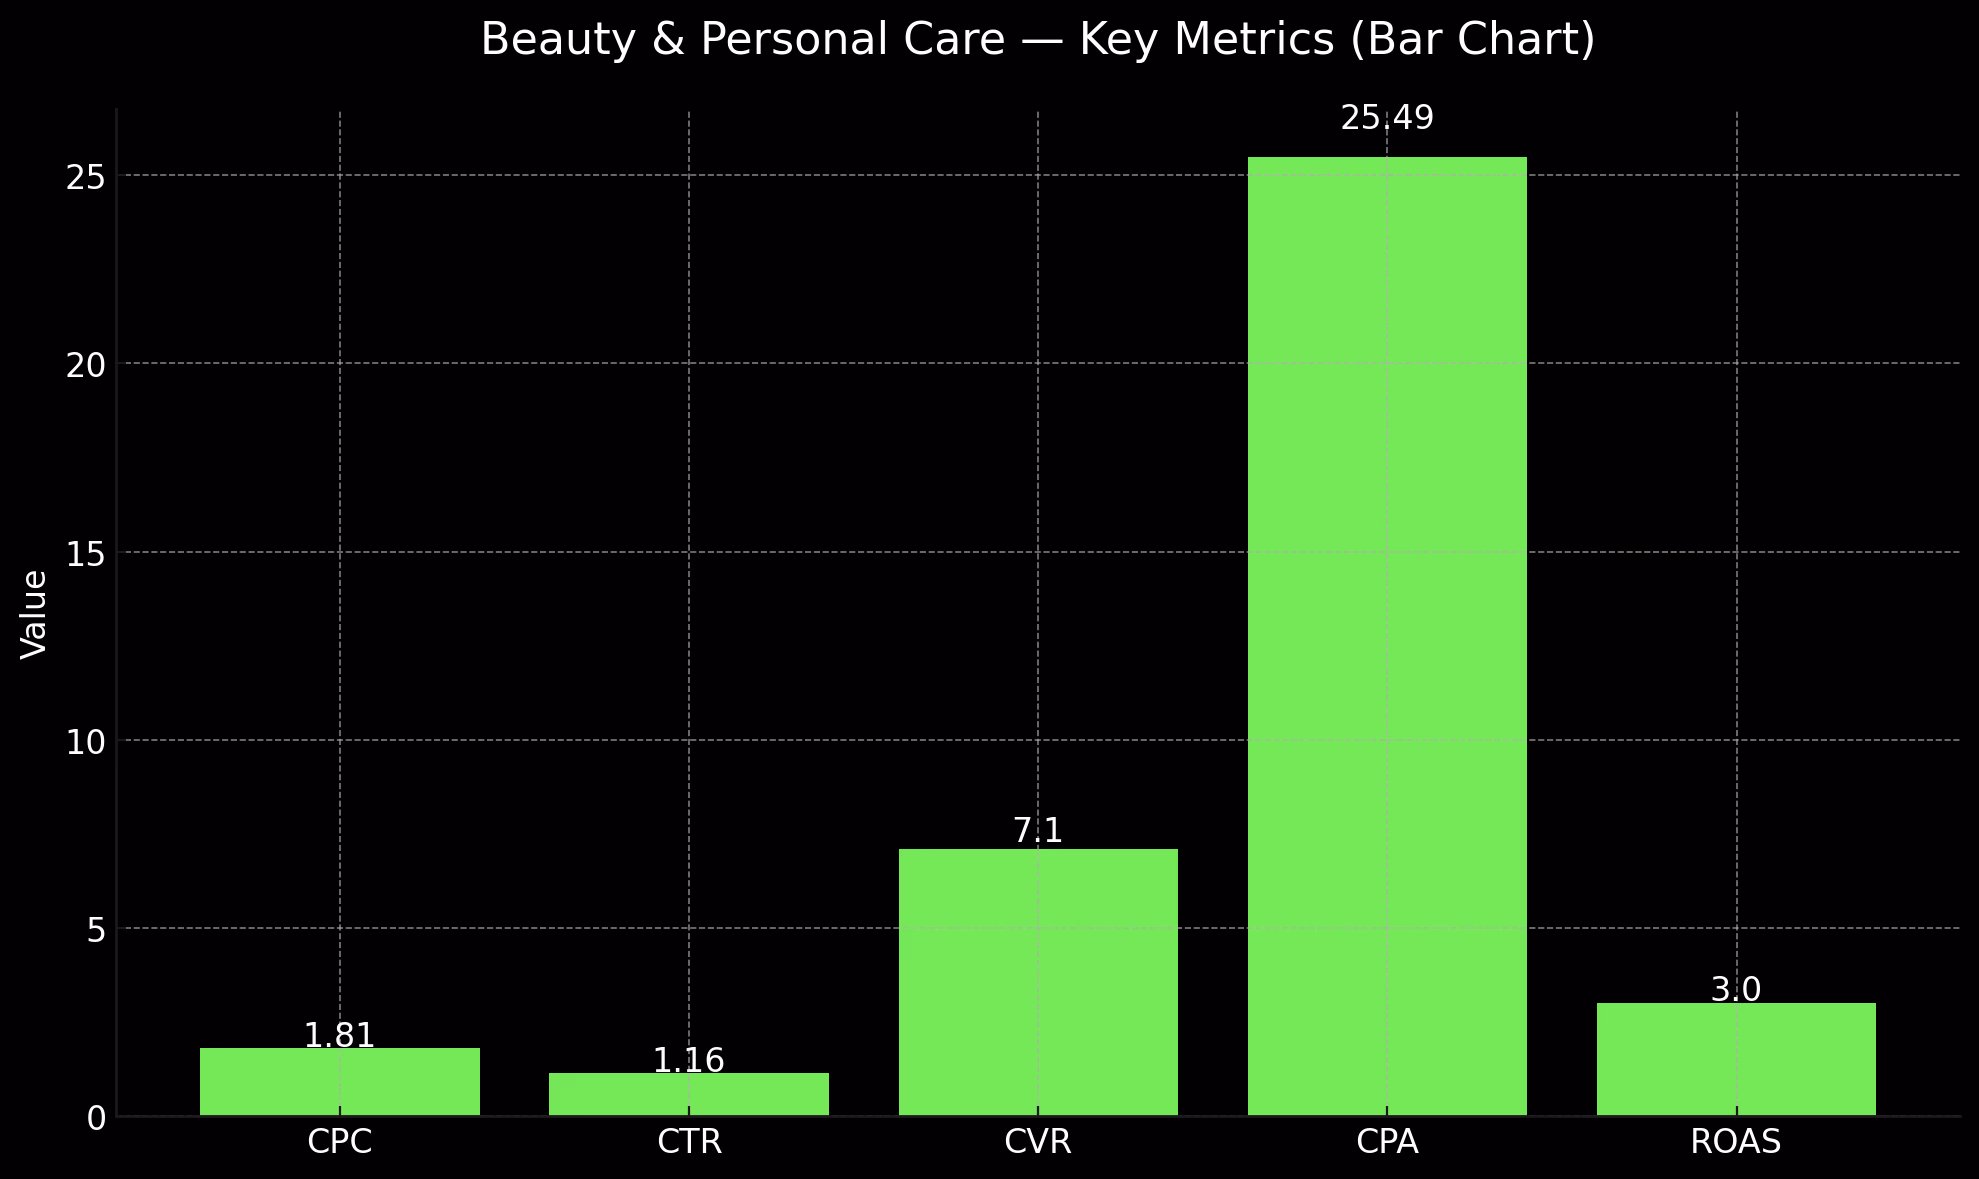
CPC ($1.81): High. You pay a premium (4x higher than apparel) to compete for high-intent buyers.
CTR (1.16%): Average. The market is saturated with similar imagery.
CVR (7.10%): Very High. Users don’t just browse; they buy solutions (e.g., acne, aging).
CPA ($25.49): Higher cost, acceptable due to high repeat purchase rates.
ROAS (3.00:1+): Strong. High conversion rates and repeat buyers drive profitability.
Strategy: Video Demonstration. Use "before/after" UGC to justify the higher click cost. You are paying for intent, not just eyeballs.
General Retail
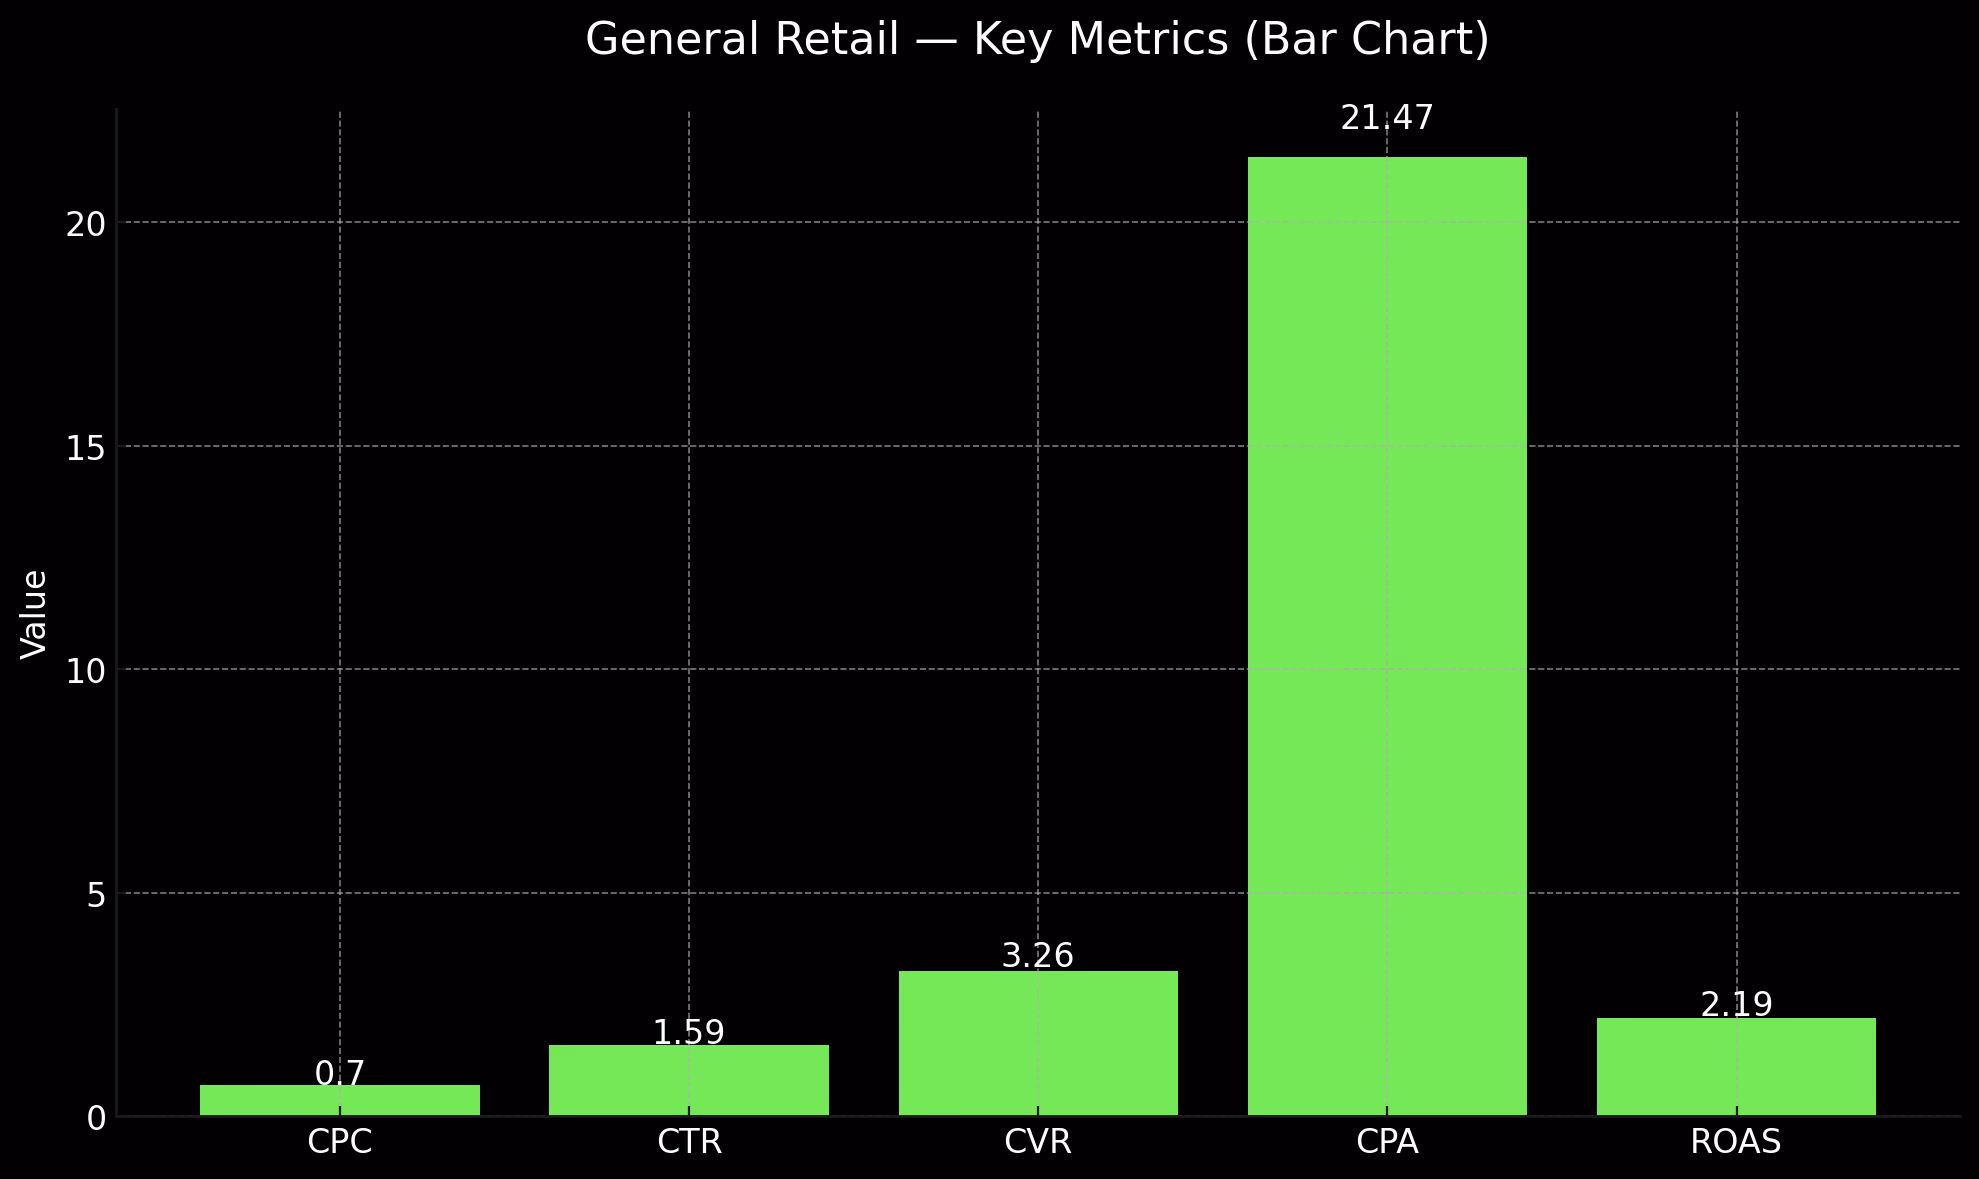
CPC ($0.70): Moderate.
CTR (1.59%): Average.
CVR (3.26%): Low. "Window shopping" is common, leading to high cart abandonment.
CPA ($21.47): Moderate.
ROAS (2.19:1): Average.
Strategy: Retargeting. Your ROAS lives or dies in the funnel. Use Dynamic Product Ads (DPA) to bring back the 97% of users who abandoned their carts.
Dynamic Product Ads automatically show each user the specific products they viewed, added to cart, or are most likely to buy. It uses real-time catalog data to personalize every ad.
B2B and Technology & SaaS: understanding higher CPA and longer sales cycles
B2B decoupled from consumer habits. You are not looking for impulse buys. You are paying to enter a consideration cycle
Technology & SaaS
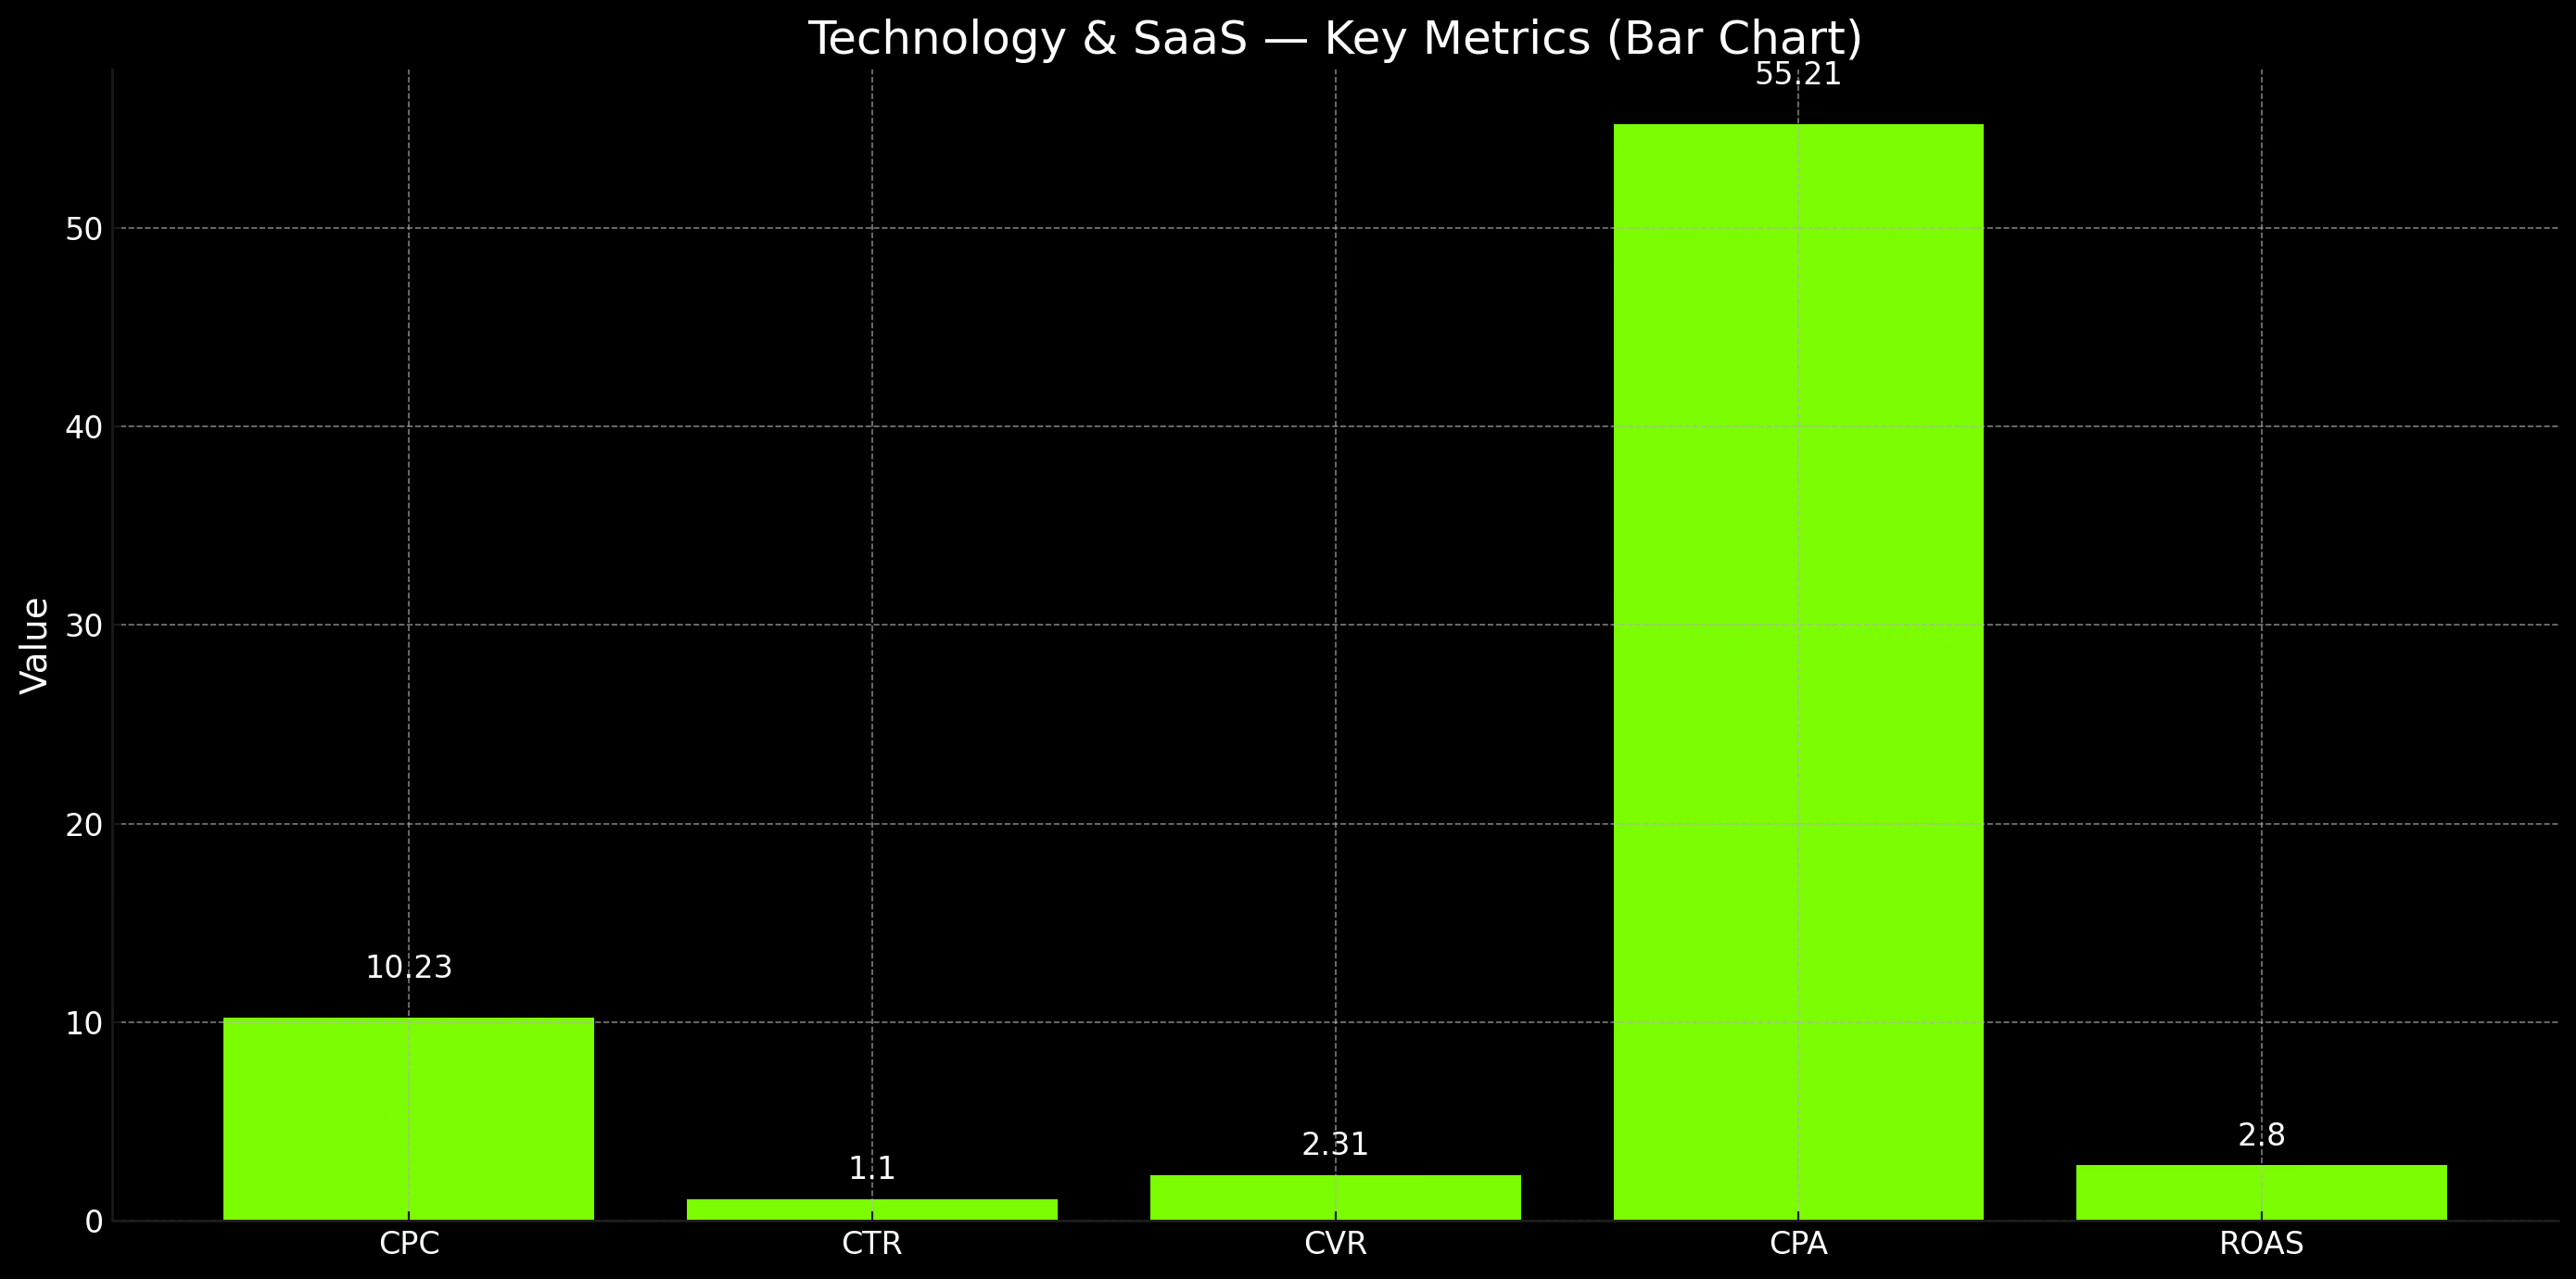
CPC ($10.23): Moderate.
CTR (1.1%): Average. Hard to stop the scroll with software ads.
CVR (2.31%): Very Low. High friction (demos, calls) reduces conversion rates.
CPA ($55.21): Highest across all sectors.
ROAS: 2.8x – 4.2x
Strategy: Pipeline Quality. Do not optimize for Link Clicks. Optimize for Completed Registrations and use the Conversions API to feed qualified lead data back to Meta.
Conversions API allows your website or app to send conversion events directly to Meta’s servers. So, you don’t lose tracking when cookies or pixels fail.
B2B
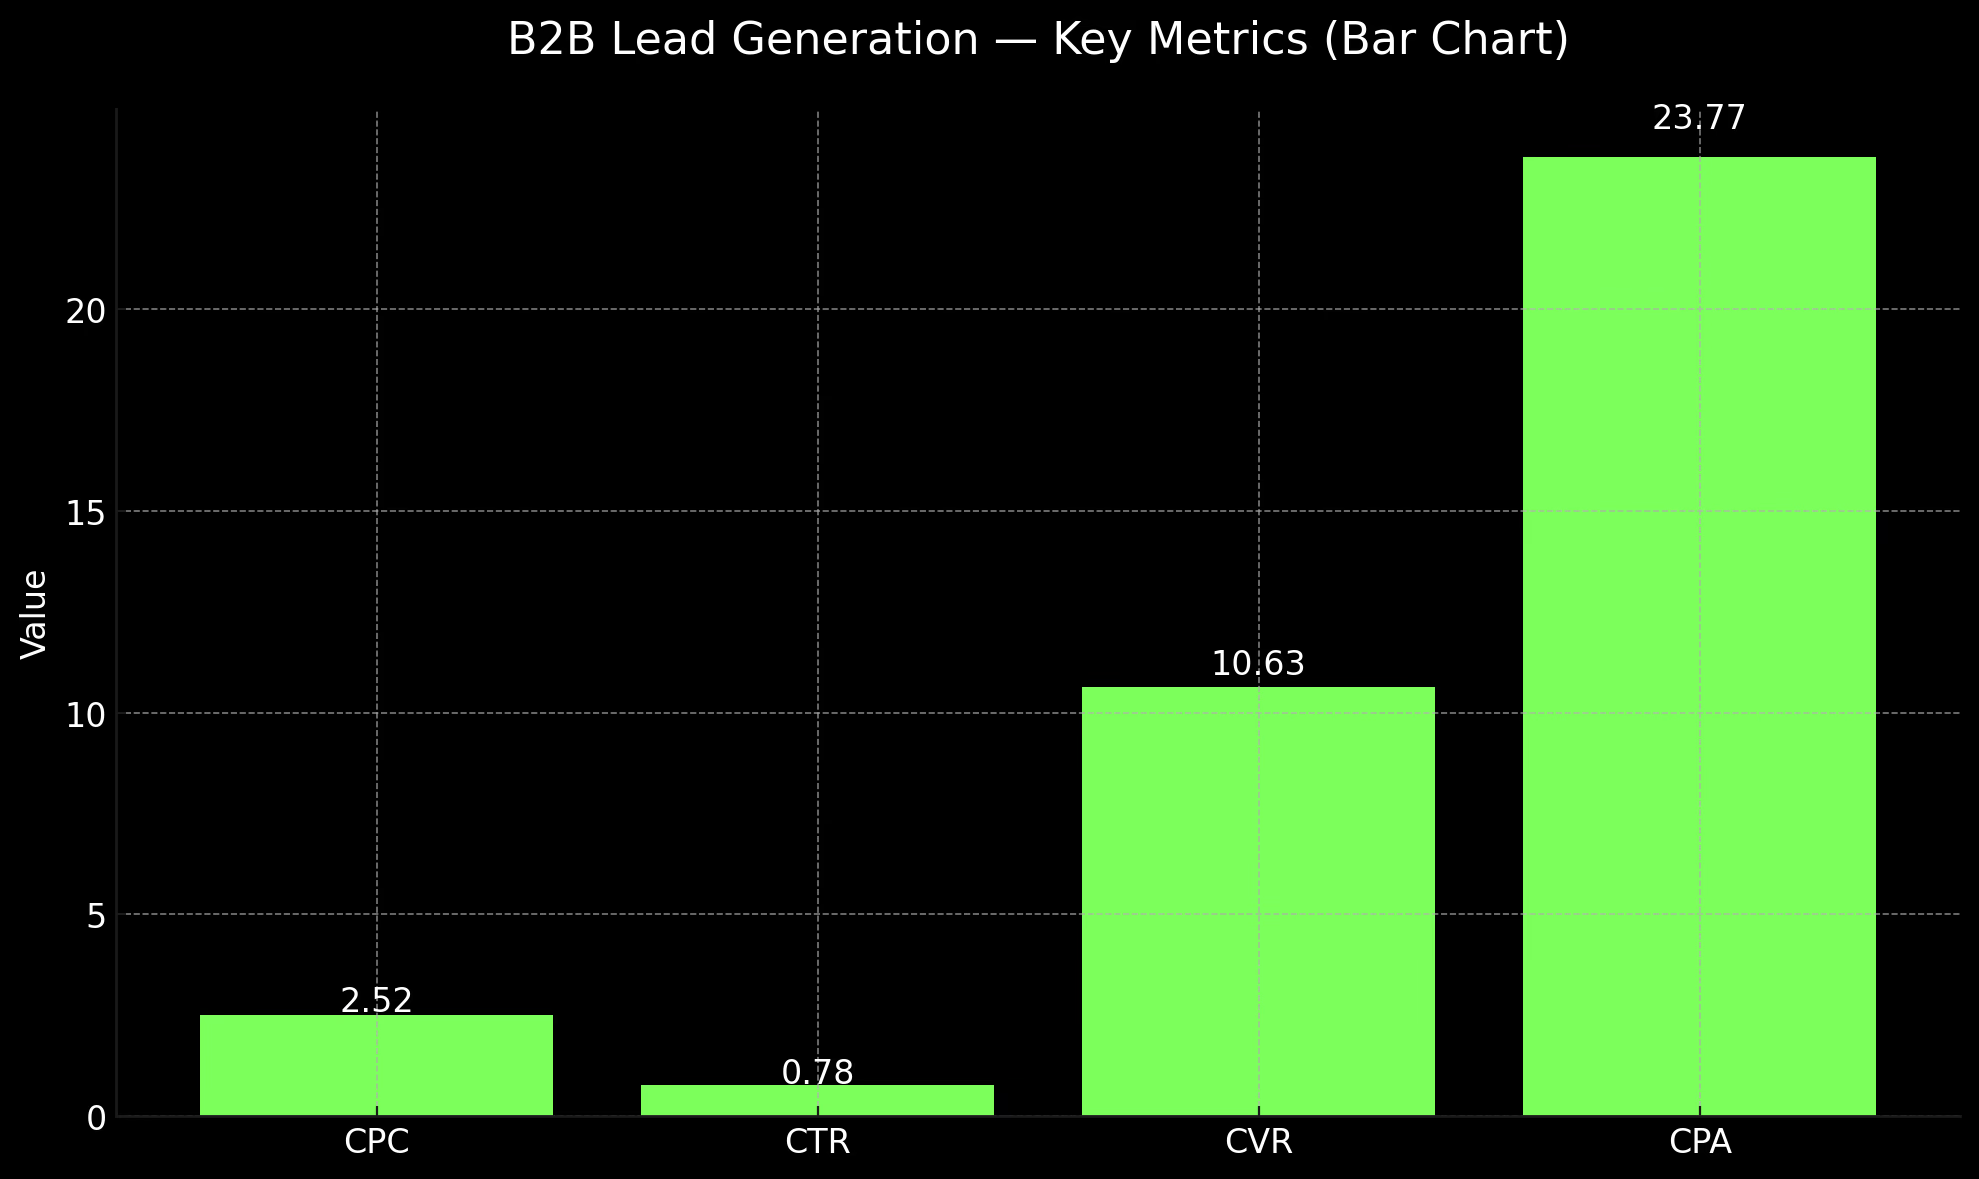
CPC ($2.52): Expensive. Professional audiences cost more to target.
CTR (0.78%): Good. Educational hooks work well.
CVR (10.63%): High. Driven by "Lead Magnets" (ebooks, templates) rather than direct sales.
CPA ($23.77): Moderate.
ROAS (LTV-Based): Judge performance by Cost-Per-Qualified-Lead (CPQL), not immediate return.
Strategy: Nurture Sequences. The gap between the cheap lead ($23) and the sale is your email funnel. Ads start the conversation. They don't close it.
Cost-Per-Qualified-Lead (CPQL) measures your average spending to acquire leads. These leads must meet your sales qualification criteria and show genuine buying intent.
Healthcare and finance: navigating high trust requirements and premium CPCs
In these sectors, you are selling "Your Money" or "Your Life." The barrier to trust is high, driving up the cost of attention.
Finance & Insurance
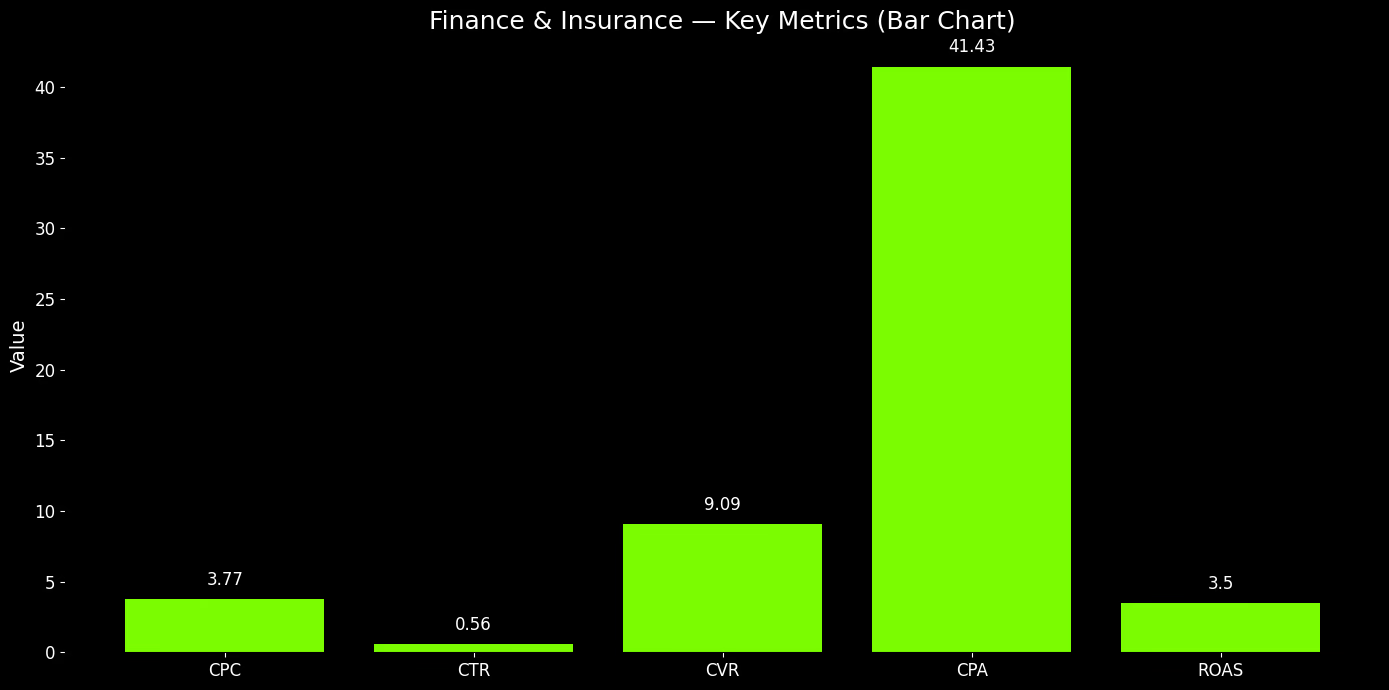
CPC ($3.77): Very High. You are bidding against major banks and fintech giants in a crowded auction.
CTR (0.56%): Average.
CVR (9.09%): High. Strong intent pushes users through complex forms.
CPA ($41.43): Expensive.
ROAS (3.50:1): Excellent. Despite high costs, the Lifetime Value (LTV) of a mortgage or insurance policy justifies the spend.
Strategy: Trust Signals. High-production video and clear, compliant copy work best. You cannot "hack" trust in this sector.
Healthcare
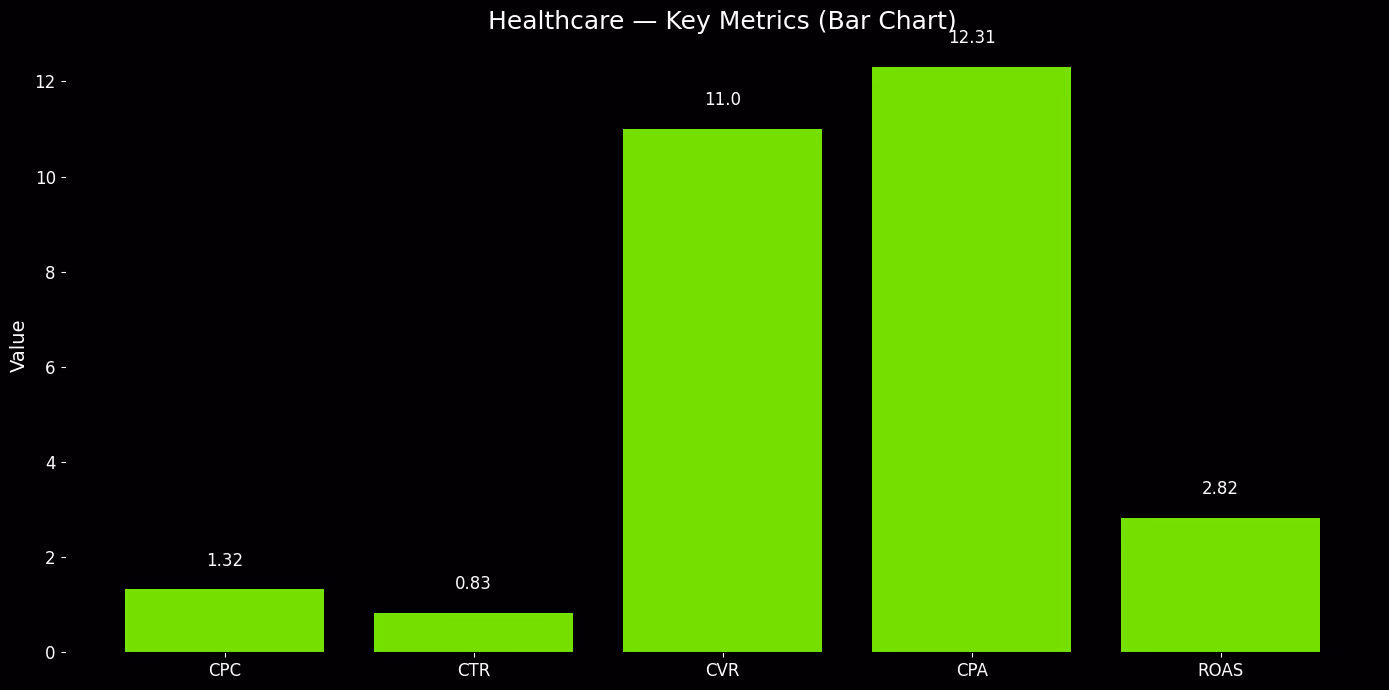
CPC (~$1.32): Moderate.
CTR (0.83%): Low. Privacy norms make targeting difficult, leading to broader reach.
CVR (11.00%): Massive. When people have a health problem, they act fast.
CPA ($12.31): Efficient.
ROAS (2.82:1): Solid.
Strategy: Pre-click Qualification. Since you cannot retarget based on sensitive health data, your ad copy must do the heavy lifting. Write copy that repels unqualified users to save budget.
Travel and hospitality: seasonal fluctuations in ad spend and ROAS
Travel is unique because the "Dreaming" phase (browsing) and the "Booking" phase (buying) are often months apart.
Travel & Hospitality
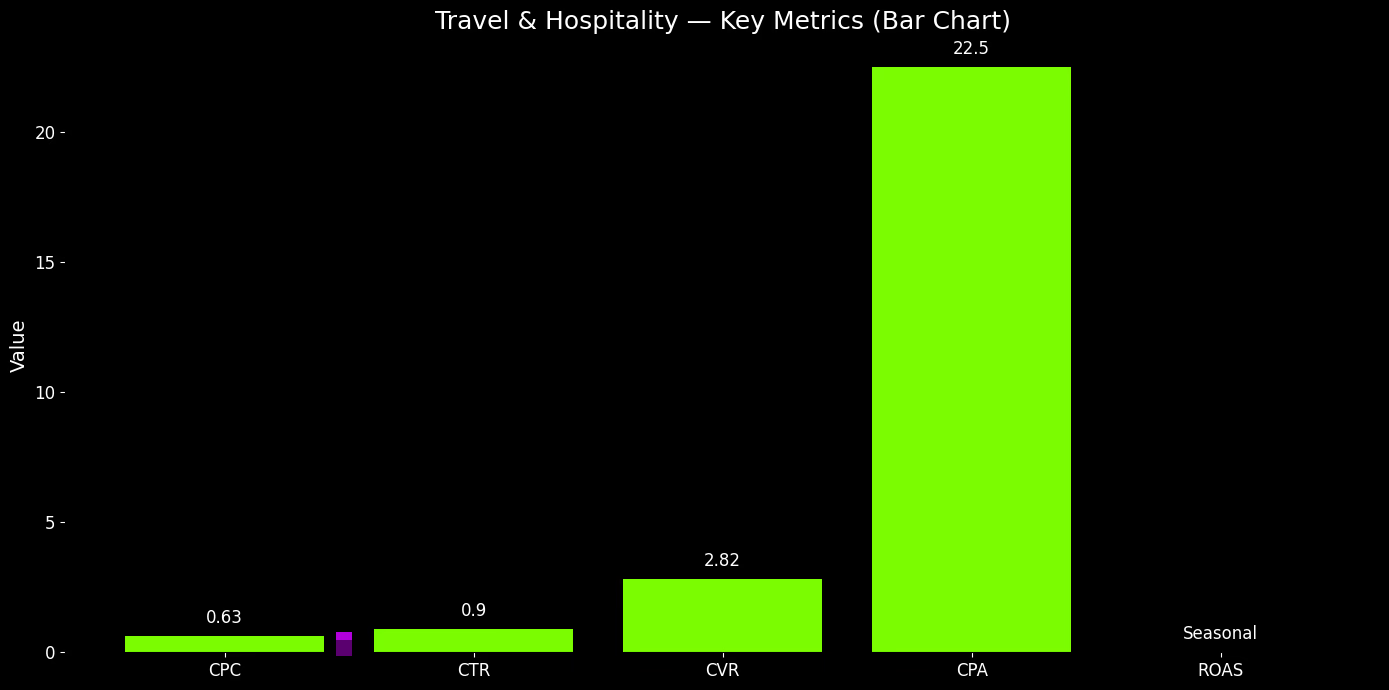
CPC ($0.63): Very Low. People love seeing travel content (escapism), so they click often.
CTR (0.90%): Average.
CVR (2.82%): Low. Users rarely book a $2,000 trip on an impulse click.
CPA ($22.50): Efficient if you can close the sale later.
ROAS (Seasonal): Highly variable. Q1 is often break-even; Q3/Q4 is profit.
Strategy: Sequential Messaging. Use cheap clicks in Q1/Q2 to build a retargeting pool. Shift budget to conversion objectives in Q3 to harvest those leads.
Real Estate
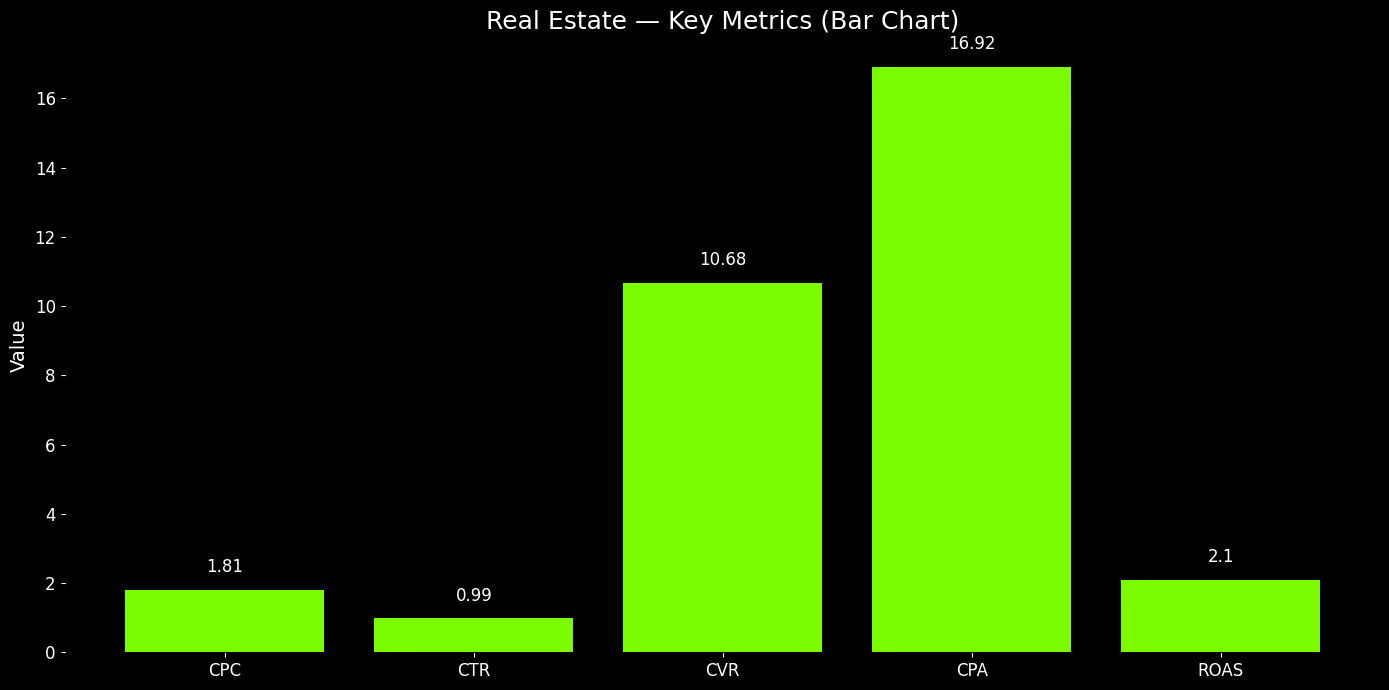
CPC (~$1.81): Moderate.
CTR (~0.99%): Average.
CVR (10.68%): High because of Facebook lead generation ads
CPA ($16.92+): High.
ROAS (2.10:1): Low immediate return.
Strategy: Lead Volume. Like B2B, ads generate leads, not instant sales. Focus on collecting contact info for agents to follow up offline.
Geographic Variations in Ad Costs: Why Region Matters More Than Ever
Ad performance benchmarks differ not only by industry but also dramatically by geography. The same campaign can cost 2–4× more or less depending on where the audience lives.
Understanding regional price dynamics is essential for setting realistic ROAS expectations and avoiding misleading comparisons.
US is the most expensive advertising region globally
According to Lebesgue’s 2024 Facebook CPM report, the United States has the highest Meta CPM in the world at $20.48. This is nearly double the cost of many European markets:
UK CPM: $10.85
Germany CPM: $10.05
India CPM: $2.70
CPC varies 2–3× across regions
Enhencer’s 2024 CPC study shows that cost per click is also heavily geography-dependent. High-income regions consistently pay more, while developing markets see significantly lower CPCs.
US averages often exceed $1 per click
Many EU countries fall between $0.40–$0.80
Emerging markets can drop far below $0.30
Why this matters for ROAS and CPA
Global averages can distort your expectations. A $25 CPA may be excellent in the US but below average in Eastern Europe. A 2:1 ROAS may be healthy in the US ecosystem but underperforming in lower-cost regions.
Hootsuite's 2024 Meta cost guide confirms this: US advertisers experience the highest CPMs worldwide. This pushes down achievable ROAS compared to cheaper markets.
Beyond the average: break-even ROAS and POAS
Average ROAS is a headline, not a strategy. Presenting this number as a target to your CFO risks chasing illusions. Benchmarks ignore your margins, shipping costs, and payment fees.
Why the 2.19:1 average misleads
ROAS measures revenue, not profit. Increasing logistics and fees erode revenue, making ROAS alone unreliable. Consider this. You sell a $30 T-shirt, spend $300 on ads, and earn $900 in revenue. That equals a 3:1 ROAS. On paper, you beat the average. But with costs at:
Product: $540
Shipping: $120
Fees: $45
Ad Spend: $300
Your total costs are $1,005, which results in a $105 loss despite a 3:1 ROAS.
Ignore vanity metrics. Identify where ad spend stops burning cash and starts generating profit. Doing this helps you outpace competitors.
How to calculate your break-even ROAS
Use the formula: 1 ÷ Profit Margin.
Dropshipper example (phone case at $40): The product costs $20, shipping runs $8, and fees total $4.20. Bringing your total cost to $32.20 and leaving you with a 19.5% profit margin.
Break-even ROAS = 1 ÷ 0.195 = 5.13:1. At 4:1 ROAS, they lose money per sale.
Premium skincare example ($100 price): costs total $33. Product $25 + shipping $5 + fees $3 means $67 net profit, a 67% margin.
Break-even ROAS = 1 ÷ 0.67 = 1.49:1. A 2:1 ROAS is healthy here.
During testing, aim for about 1.5–2 times your break-even ROAS. When scaling, target 2–3 times. Don’t rely on guesses calculate precisely.
Want to skip the manual calculations? Use our ROAS break-even calculator to instantly determine your profit threshold and see exactly what ROAS you need to scale profitably.
Reverse-Engineer Successful Stores
Learn exactly what makes top Shopify stores successful. Analyze their traffic sources, apps, themes, and best-selling products to replicate their success.

Shift from ROAS to POAS for scaling brands
POAS (Profit on Ad Spend) equals Gross Profit divided by Ad Spend. It includes COGS, shipping, taxes, and overhead before you celebrate results. For example, $1,000 ad spend generates $5,000 revenue; total costs are $4,000, leaving $1,000 gross profit.
POAS = 1:1, which means breaking even.
Benchmarks for POAS:
1:1 POAS is break-even
2:1 POAS indicates healthy, sustainable growth
3:1+ POAS signals aggressive scaling
Using POAS prevents scaling campaigns that look good in Ads Manager but harm cash flow. Launch campaigns with confidence backed by real data.
Subscription models and LTV: play the long game
Initial ROAS often appears poor for subscription and high-retention businesses, but backend value changes everything. For example, a coffee subscription with a $30 starter kit costing $20 and a $25 customer acquisition cost.
First-transaction ROAS is about 1.2:1 and loss-making initially.
Over 8 months, total revenue reaches $240, turning the cohort profitable.
Month 3 ROAS reaches about 2.1:1 (break-even)
Month 12 ROAS hits roughly 8.2:1 (profit)
In high-retention sectors, you can accept Day-1 ROAS between 0.8:1 and 1.5:1 if the cohort lifetime value supports it. Focus on tracking cohorts, not just Day 0.
Subscription businesses operate under different unit economics—dig into how subscription brands structure their ad spend to see how profitable players balance Day-1 losses with long-term cohort value.
Final practical demands
Stop optimizing for headline ROAS. Instead, calculate your break-even ROAS, measure POAS, and model customer lifetime value before scaling.
To outpace competitors, focus on the math behind each channel and the lifetime value of each customer. Use data to make decisive moves. No more endless scrolling.
Optimizing your meta ad strategy with Trendtrack data
Industry averages provide baseline noise. To gain an advantage, you need precise insights on your closest competitors. Trendtrack reveals whether they bluff with big budgets or hold top-performing creative. This data lets you validate ideas based on evidence instead of guessing.
Leveraging Trendtrack to uncover real-time competitor ad strategies
Scrolling through Facebook Ad Library and admiring ads without context wastes time. Instead, focus on patterns that reveal true strategy.
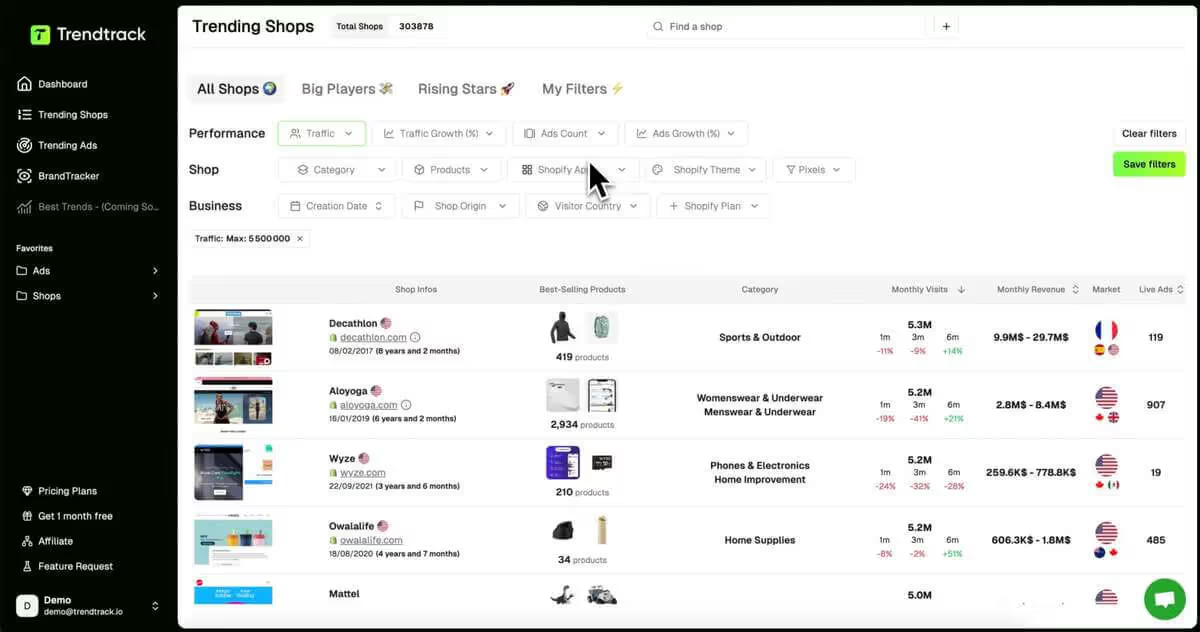
Start with the Trending Shops tab. Filter for:
Shops with 10,000+ monthly visits
50%+ traffic growth in 30 days
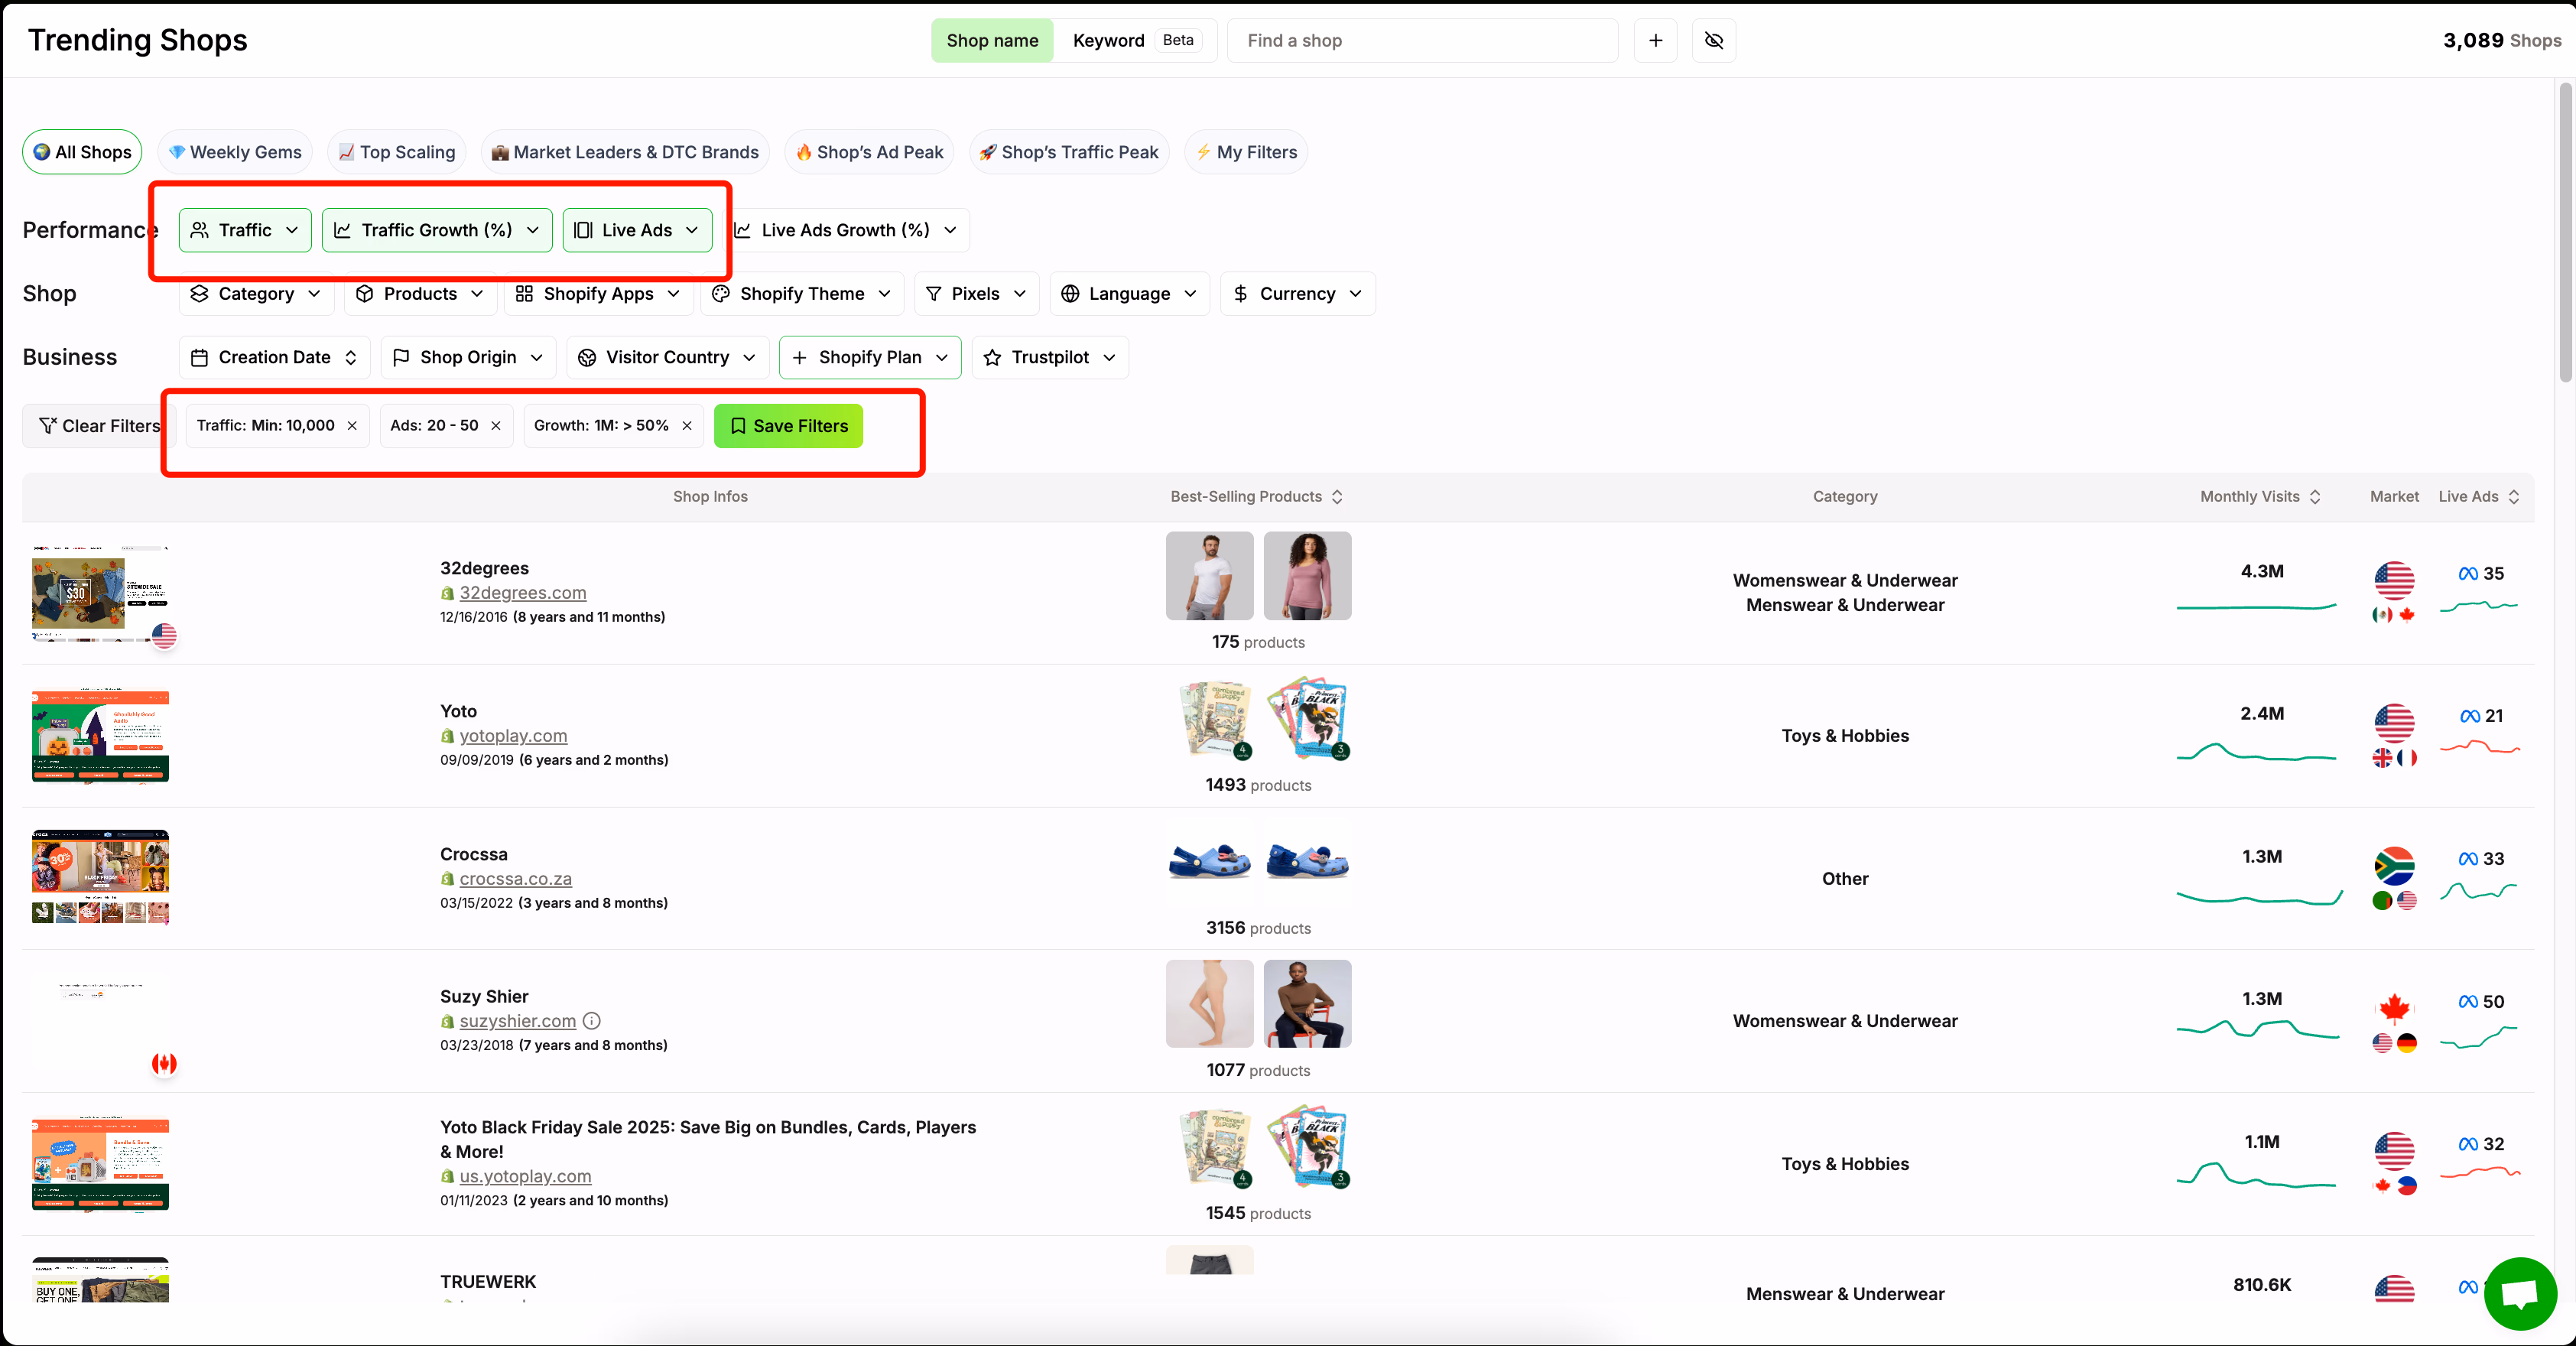
Add an Ads Count filter targeting stores with 20 to 50 active ads. This range signals structured testing and real spending, avoiding hobbyist noise.
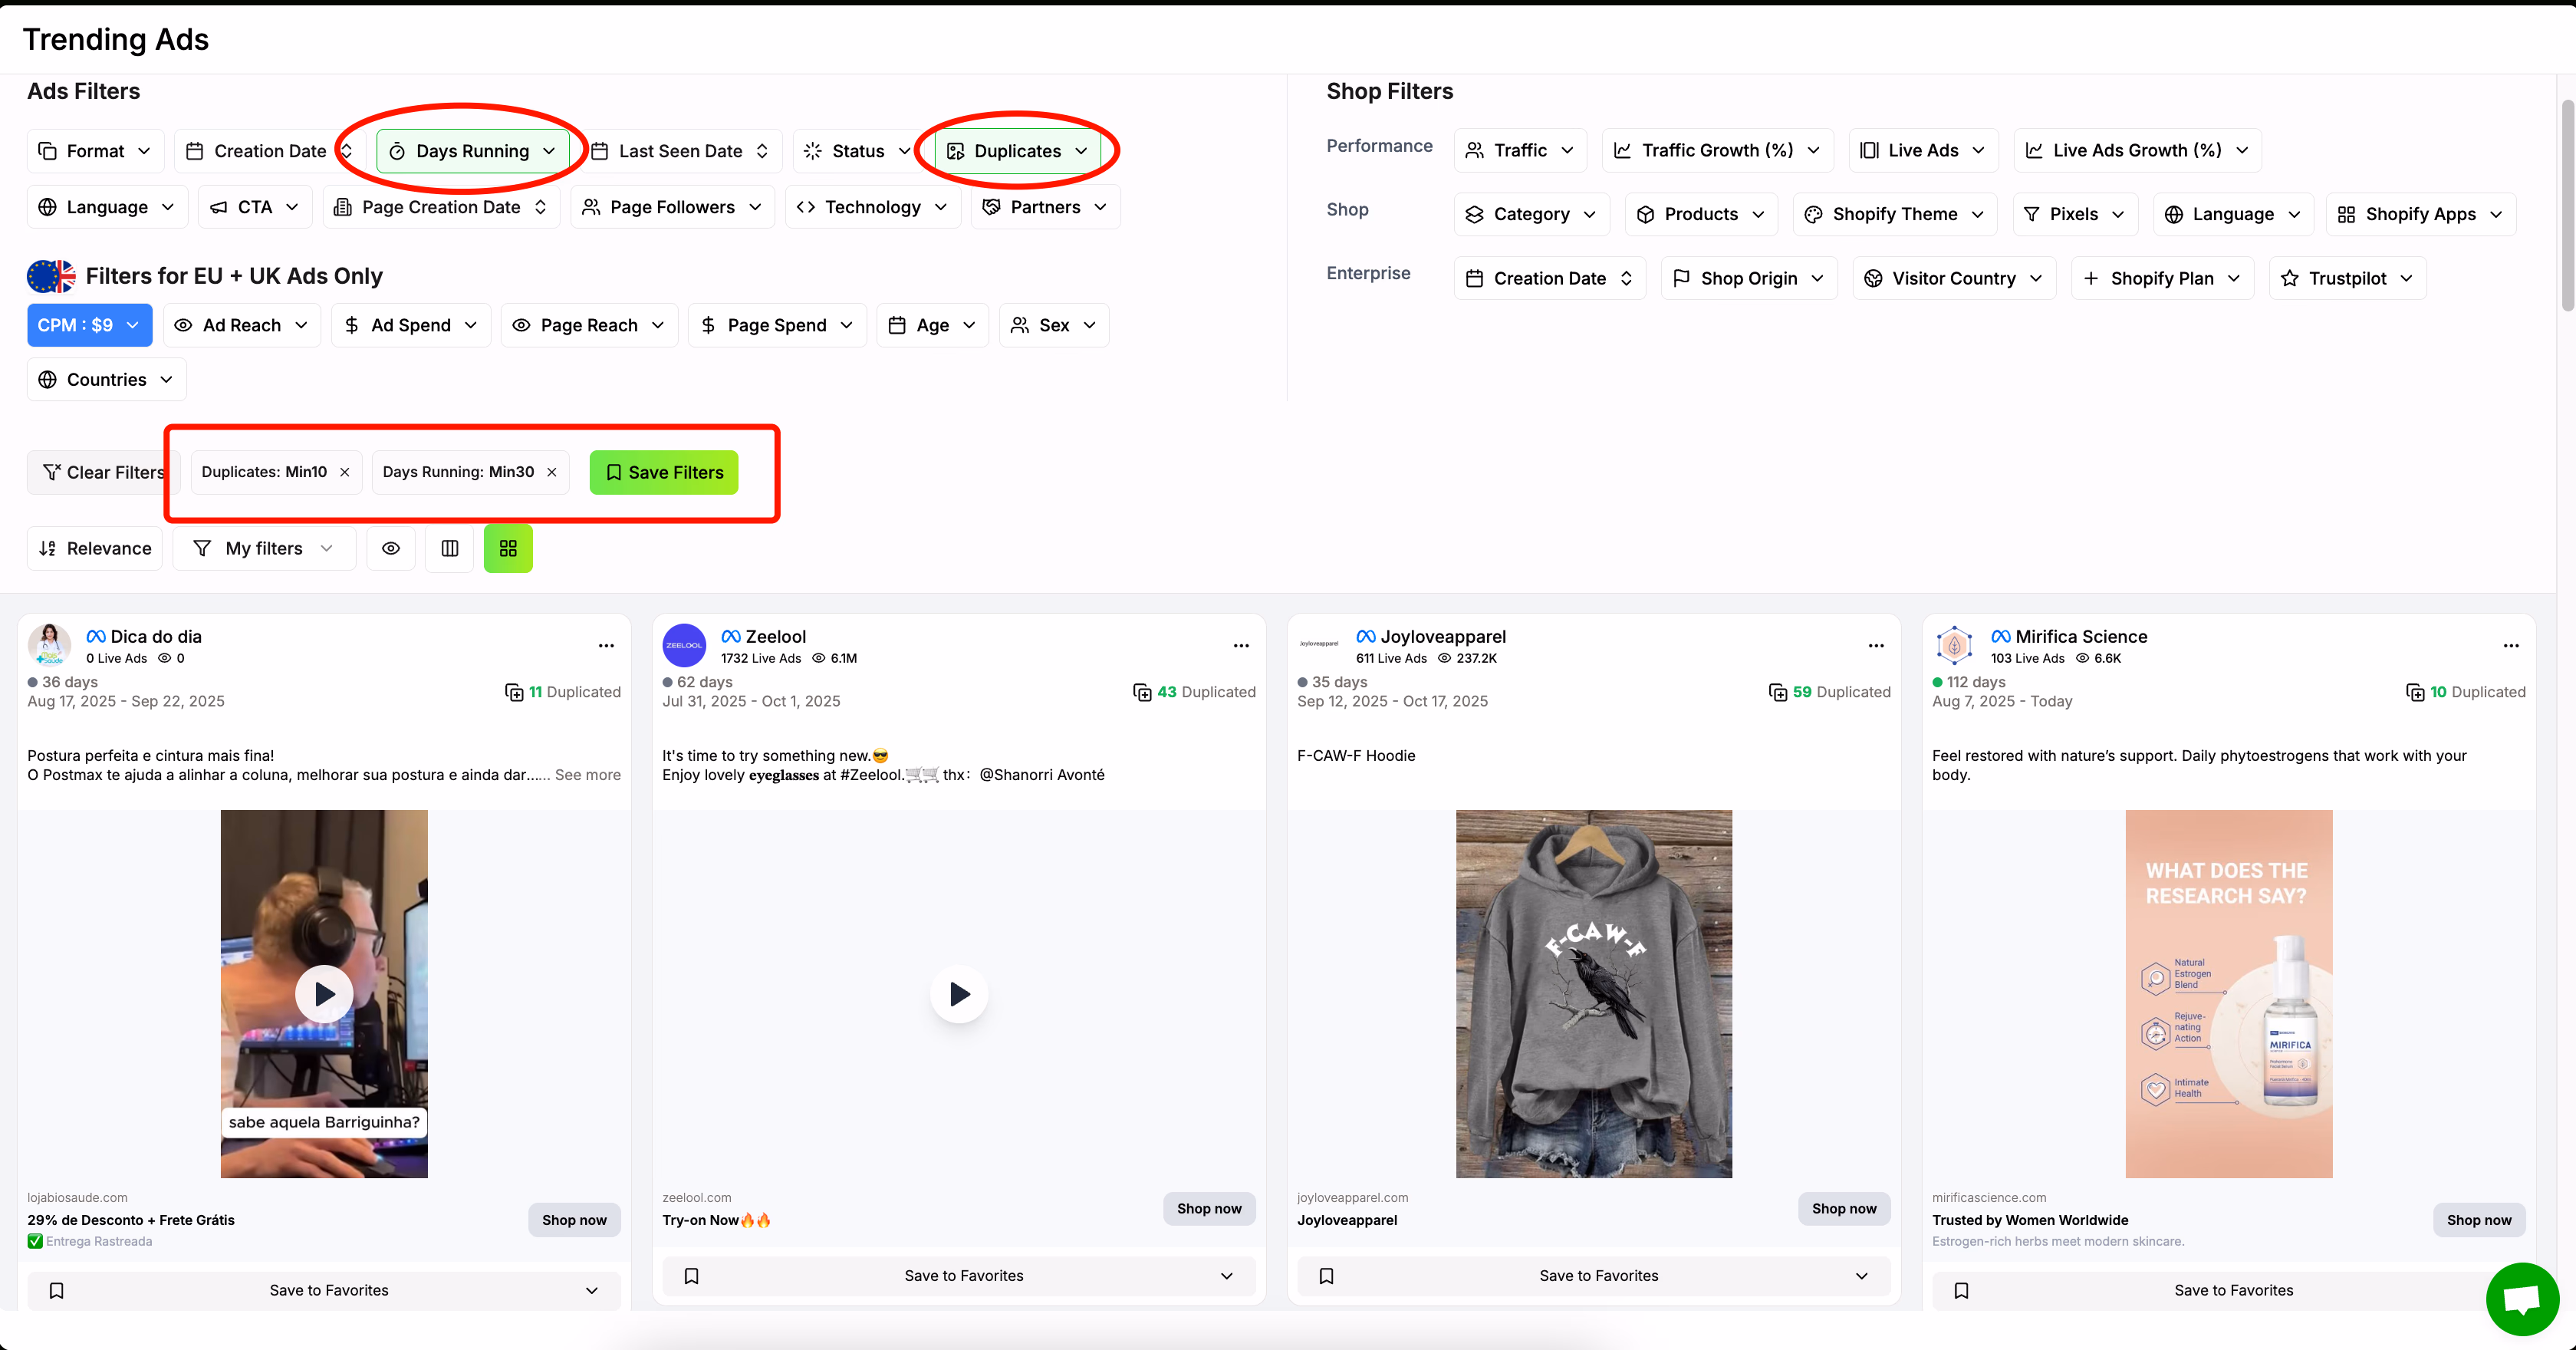
Then explore the Trending Ads gallery:
Ads duplicated 10+ times across campaigns indicate high-budget tests
Ads running for 30+ days are survivors; those that fail don’t last a month
Focus on these survivors, as they show where money flows. Validate your ideas by concentrating on proven winners, not guesses.
Using Brandtracker to spot sudden spikes in competitor ad launches
Catching competitors during launch phases gives you an edge. Brandtracker's Ads Launched Trend chart reveals scaling signals through significant jumps in active ads. Such as increases from 15 to 45 weekly.
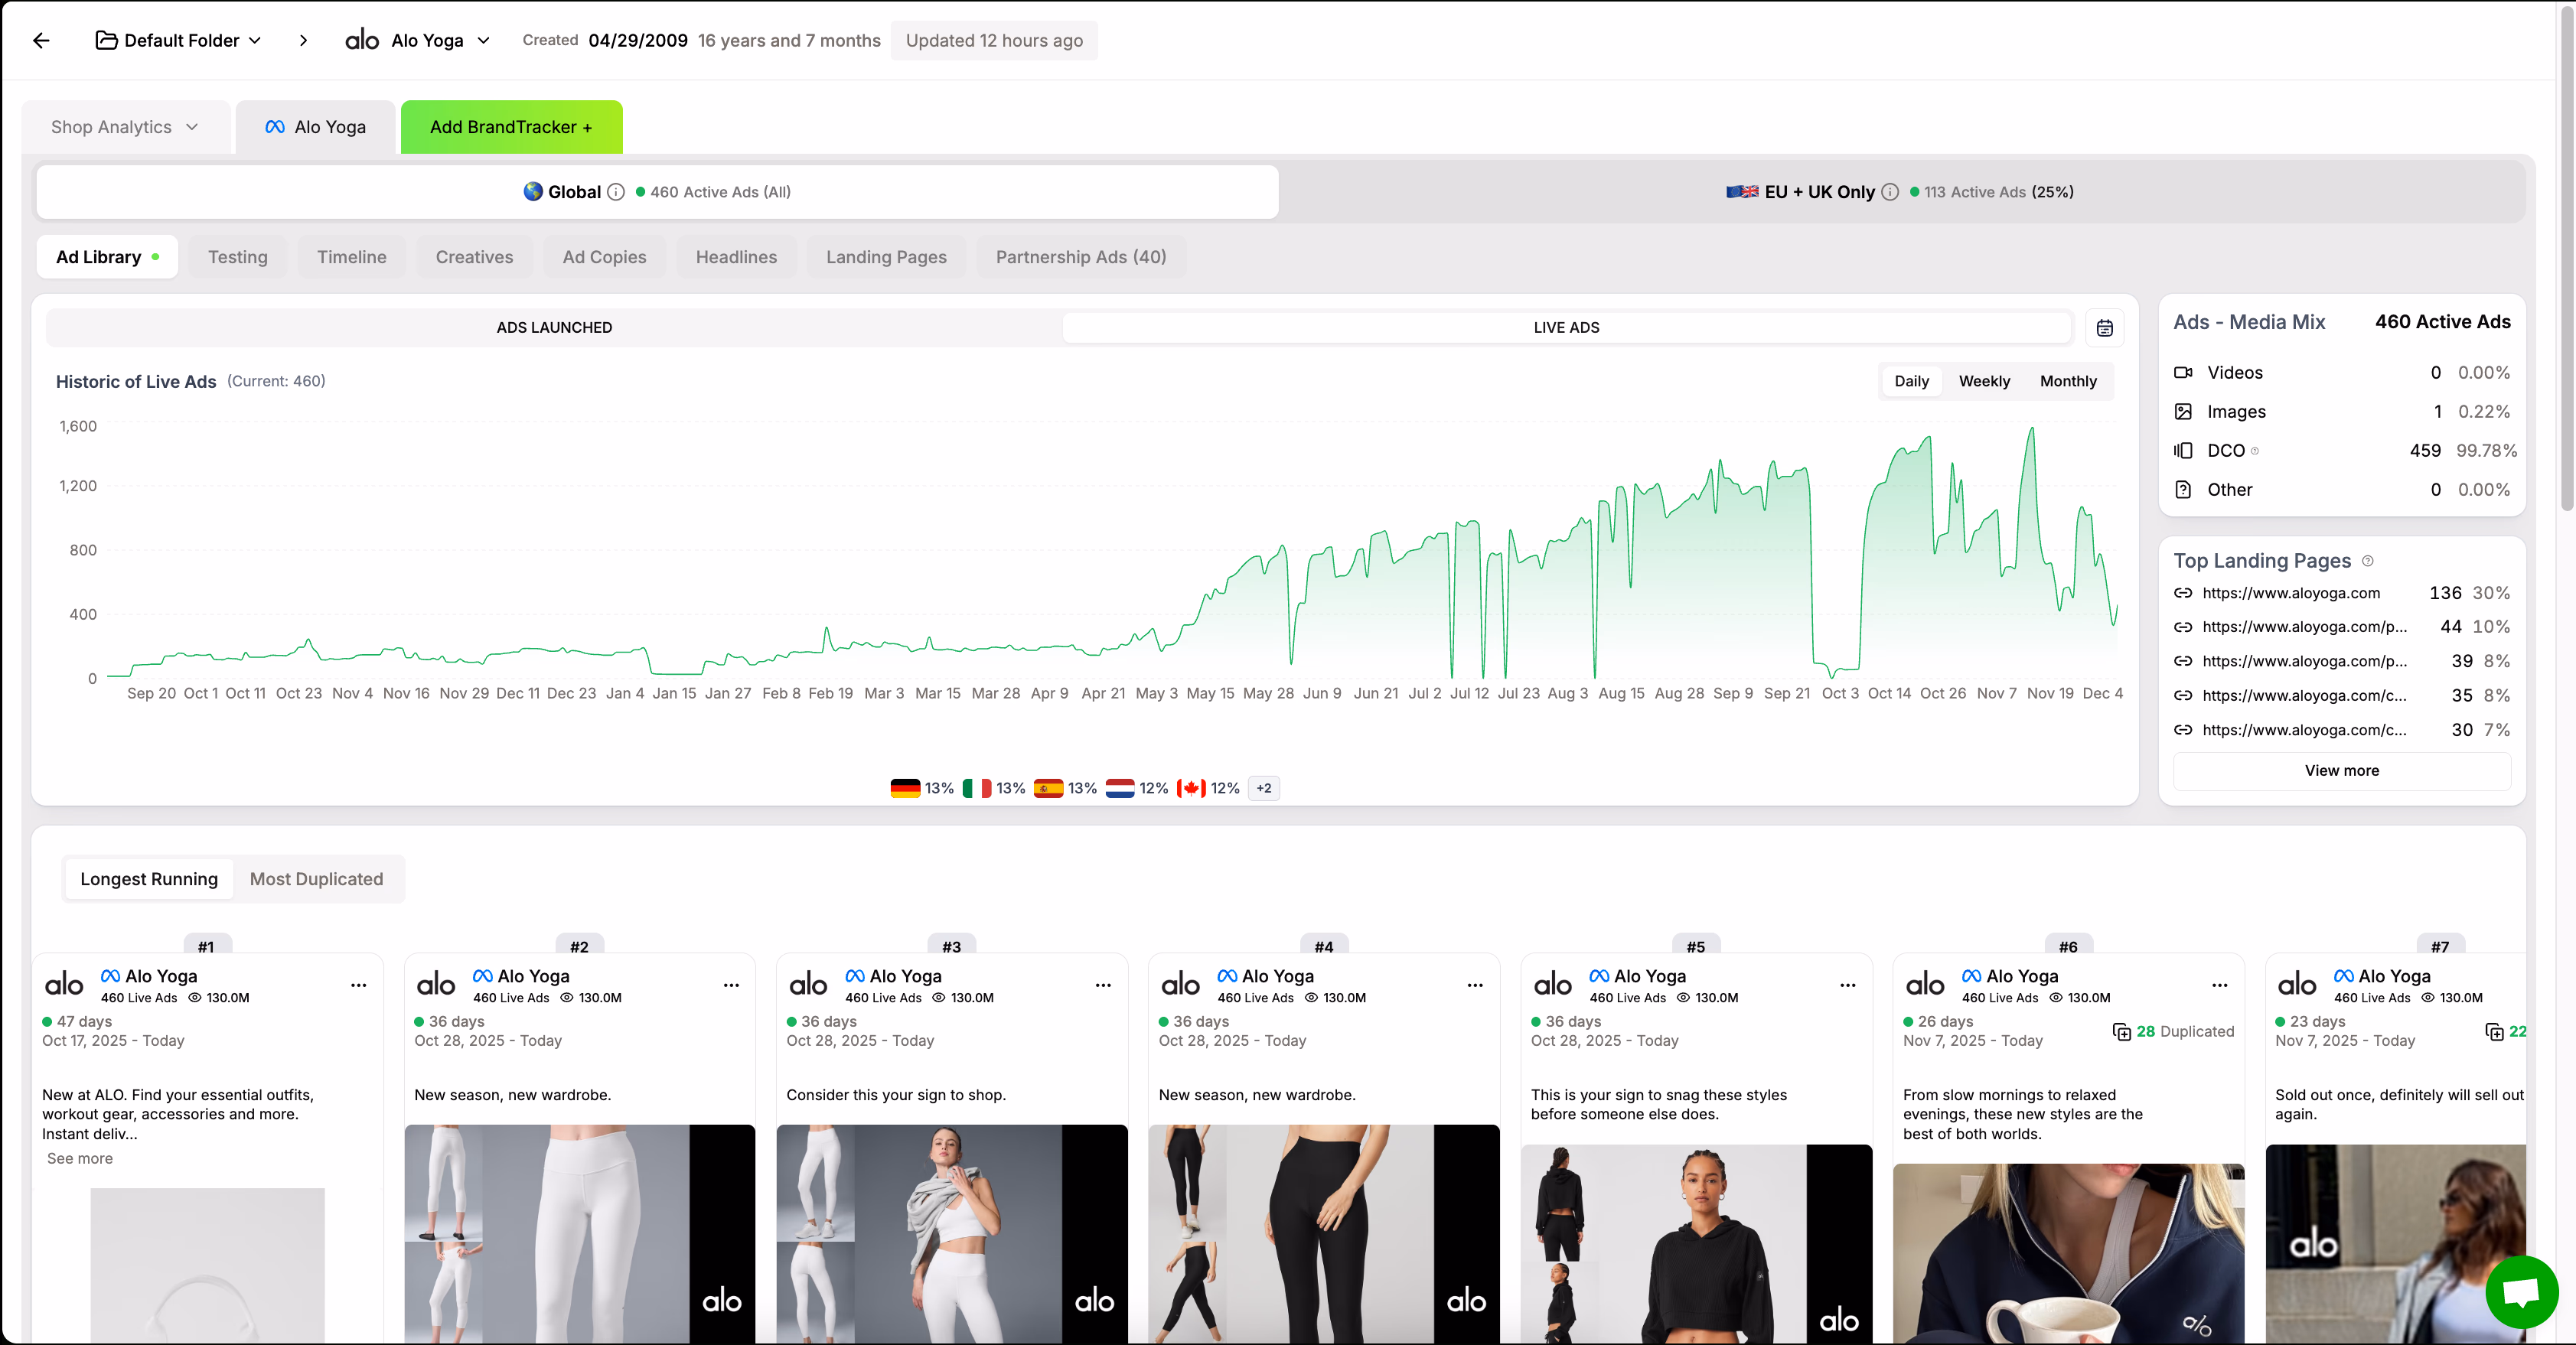
Use the Testing tab to find variants that survive. For example, if 20 variants launch and 18 die in 48 hours, ignore the noise and study the two survivors closely.
The Creative Library reveals seasonality trends like Black Friday and Mother's Day, helping you align your promo calendar.
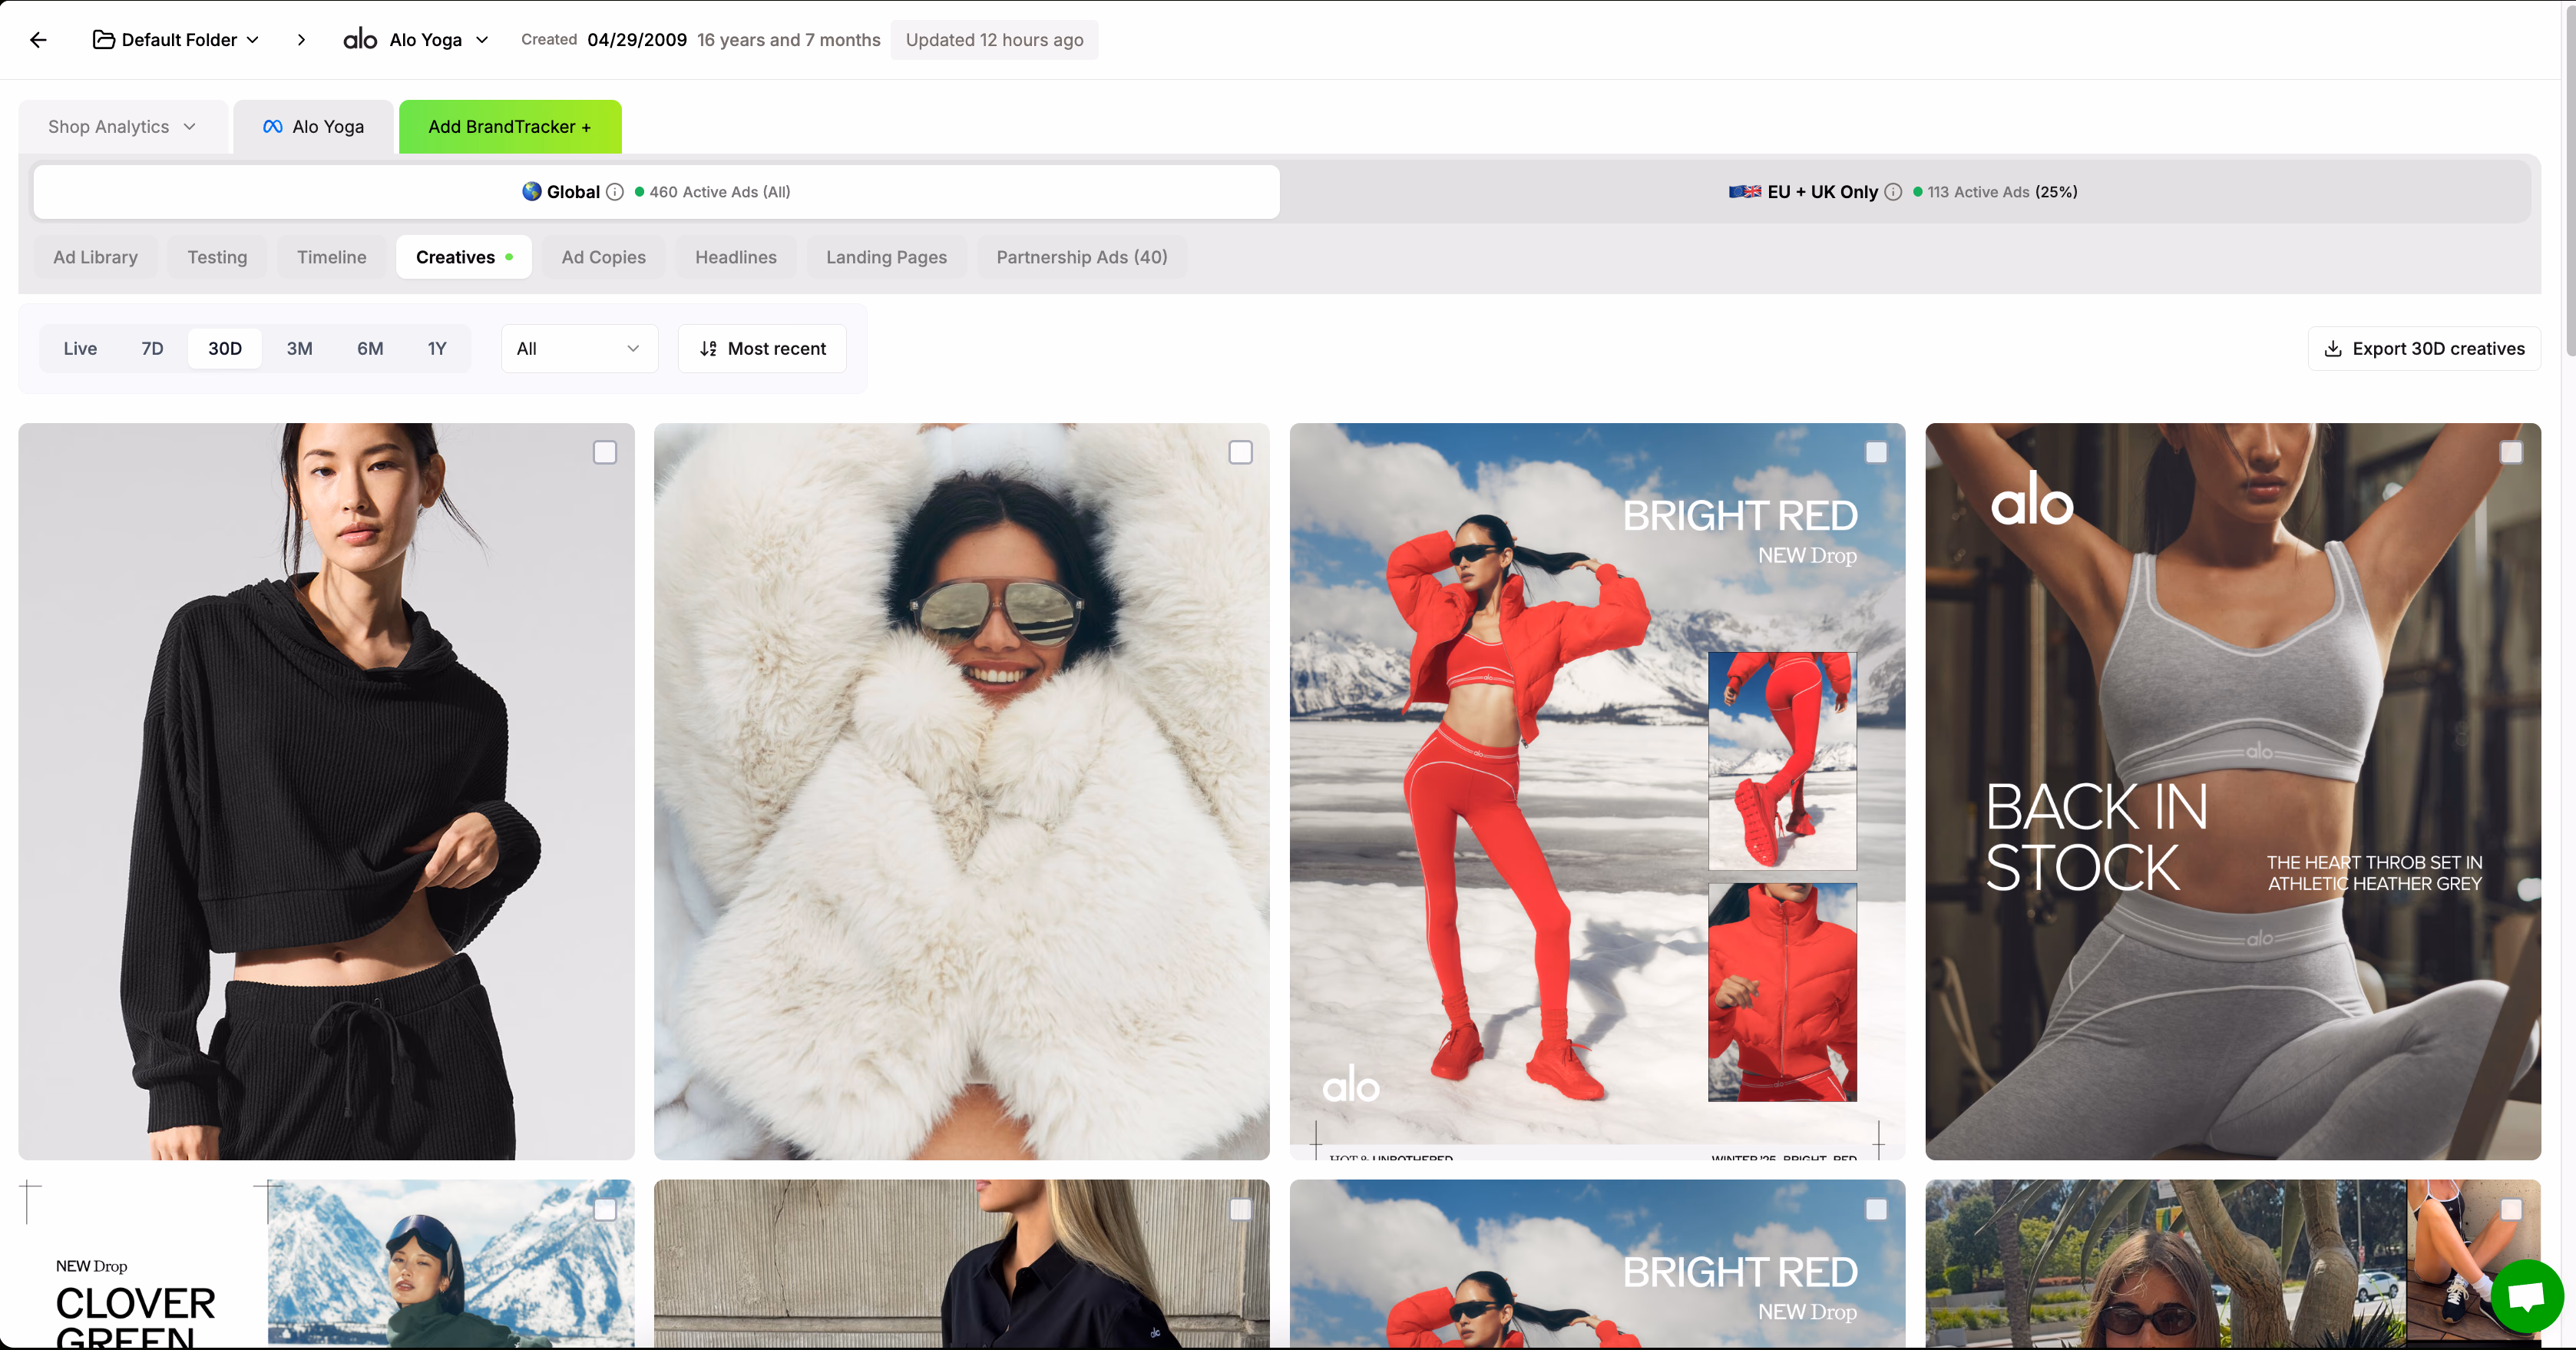
When competitors ramp up, mirror their pace without copying their budget. Steal the structure of successful campaigns, not their spending levels.
Analyzing traffic sources to validate if high ad spend is driving actual growth
Ad spend without traffic growth is just showmanship. Verify impact by comparing ad volume to traffic spikes.
For instance, if a competitor runs 50 ads for three weeks and traffic grows 40%, that points to a sustained, profitable campaign.
If they churn creatives but traffic remains flat, they haven’t found their break-even ROAS. Learn how to track competitor ads across platforms to build a more comprehensive case file beyond creative and traffic data.
Check Shopify Apps and Theme detectors too. Sudden tech stack changes or a site redesign often accompany scaling efforts. Build a full case file that includes creative, traffic data, and technology changes instead of relying on isolated signals. You can try Chrome extension for quick results.
Turning competitive intelligence into lower CPA and higher ROAS
Data by itself does little. Use your insights to estimate competitor spend and adjust bids and creatives to outperform them.
Estimate weekly spend with this formula:
(Active ads × Average longevity) × (CPM benchmark ÷ 1000) × Estimated impressions
For example, 50 ads running 21 days, about 2 million weekly impressions, $7 CPM means roughly $14,000 per week.
This range lets you match bid rhythms effectively. Attack on weekdays when competitors are weak, and defend during concentrated weekend campaigns.
Save the longest-running winners in your Ad Library. Reverse-engineer their headlines, hooks, and CTAs. Run controlled tests to validate those angles. Replicate campaign structure without copying budget.
Launch confidently with data. Shorten test cycles and stop wasting hours scrolling. Steal strategies from the top DTC brands to lower your CPA and increase your ROAS.
Save Hours of Research Time
Stop checking five different tools. Trendtrack provides better insights in one platform. Save time and streamline your research workflow.
Final words
Industry averages won't save you. Your break-even ROAS, competitor movements, and creative refresh rate will.
Calculate your actual break-even ROAS. Not the "average." Benchmark your CPC, CVR, and CPA against your specific industry. Identify which competitor ads are survivors, not tests. Then scale what works and kill what doesn't.


.avif)


Are you ready to get the insights?
From viral trends to million-dollar stores — unlock the insights behind what sells, scales, and converts. All in one place.