How to Calculate Facebook Ads Budget in 4 Simple Steps [2026]

![How to Calculate Facebook Ads Budget in 4 Simple Steps [2026] featured image](https://cdn.prod.website-files.com/67d4bd9c948efd23af34f142/694bec5bb888470bde1485e1_67cb9e84dbee0c171b75799b%252F694bec5bd7a5c39e2707b45e_featured-image-how-to-calculate-facebook-ads-budget-png.avif)
Most Facebook advertisers start with a random number. They pick a daily budget based on gut feeling, what they can "afford to lose," or what they saw another brand doing. Then they wonder why they're bleeding money with no clear path to profitability.
Here's the truth: your Facebook ads budget isn't arbitrary. It's a direct calculation based on your profit margins, revenue goals, and acquisition costs. Get it wrong, and you'll either underspend (starving the algorithm of data) or overspend (burning cash on unproven creatives).
In this guide, you'll learn:
The reverse-engineering method to calculate your exact budget from revenue goals
Break-even ROAS formulas so you know your minimum threshold before spending a dollar
Three strategic approaches for new advertisers, steady growers, and aggressive scalers
Real-world scenarios with actual numbers for ecommerce, services, and subscription businesses
How to benchmark your budget against competitors using real market data
Whether you're testing your first campaign with $100/day or scaling to $50,000/month, you'll walk away with a budget backed by math—not guesswork.
How to Pick the Right Budget Type for Your Advertising Goals
Your starting budget should balance risk and data volume. There's no magic dollar amount. It depends on your risk appetite and your need for meaningful data.
Consider these three factors:
The “afford to lose” threshold. Choose an amount you can afford to lose. Avoid using money needed for essentials like rent or payroll.
The “care enough” threshold. Spend enough so losing that amount matters to you. If losses don't affect you, you may not optimize effectively.
Minimum viable spend. You can technically start at $5 per day, but this rarely drives results if your acceptable acquisition cost is $50 or more. Low spending means you’ll wait days or weeks for conversions. You need volume to generate useful data—launch with enough budget for real results.
A good rule is to pick a budget between won’t kill the business and I’ll actively manage this campaign. Avoid checking every second. Focus on the right metrics at the right times.
Campaign budget optimization vs. ad set budget optimization
Where you set your budget matters as much as how much you spend.
CBO (Campaign Budget Optimization) means you set one budget at the campaign level. Meta automatically distributes it across ad sets, audiences, and creatives in real time.
ABO (Ad Set Budget Optimization) means you manually assign a specific budget to each individual ad set. Meta respects those limits but doesn't reallocate money between them.
Why CBO wins for growth:
For growth-focused brands, use CBO. The algorithm distributes your budget to what performs best, adjusts in real time, and removes manual guesswork. You scale faster because Meta tests new audiences automatically.
ABO requires constant management and slows scaling. Only use it if you need strict control over specific audience spending.
CBO helps you outperform competitors by letting the platform's data guide budget allocation instead of relying on intuition.
Understanding How Meta’s Auction Sets Your Cost
CPM is the price you pay for every 1,000 ad impressions on Facebook. It's one of the primary factors that influences your overall ad spend.
Facebook's auction system also shapes your costs. It determines which ads get shown and at what price.
Your budget competes in a dynamic auction. Prices change due to:
Competition from other advertisers
Seasonality and timing
Your campaign objectives
Consider these key points.
Campaign Type | Avg ROAS | CPM Range | Best For | Notes |
|---|---|---|---|---|
Cold Awareness | 1.2:1 - 1.8:1 | $0.50-$2.00 | Top-of-funnel | Cheap reach, lower conversions |
Retargeting | 6:1 - 12:1 | $2.00-$5.00 | Warm audiences | High efficiency, limited scale |
Lead Gen (Cold) | 2.0:1 - 3.5:1 | $1.00-$3.00 | Service businesses | Medium cost, predictable leads |
Ecommerce (New) | 1.5:1 - 3.0:1 | $0.75-$2.50 | Product sales | Variable by niche |
Q4 Holiday | 4:1 - 5:1 | $3.00-$8.00 | Seasonal spike | High demand, competition |
Q1 Slow Season | 1.8:1 - 2.2:1 | $0.50-$1.50 | Budget testing | Cheap testing ground |
The 2025 reality check: The average Facebook ads ROAS across industries is 2.19:1, roughly $2.19 returned for every $1 spent. But this average masks wide fluctuations caused by auction dynamics.
Competitive intensity: When more advertisers increase their CPMs, ROAS tends to drop. For example, if a competitor increases their active ads from 20 to 80, they raise auction pressure and drive up your costs.
Campaign objectives shape costs: Cold audience or awareness campaigns typically show a lower ROAS but are cheaper to reach. Remarketing campaigns tend to have higher ROAS (6:1 to 12:1), but costs rise as frequency increases. Avoid cutting top-of-funnel awareness spend while celebrating high-ROAS remarketing. You need to invest in awareness to sustain returns down the funnel.
Seasonal fluctuations affect auctions: In Q4, ROAS can jump to 4–5:1, but CPMs also rise sharply. In Q1, ROAS often falls to 1.8–2.2:1 as demand softens.
Expect cost volatility. Often auction mechanics, not your creatives, cause changes. Validate offers without guessing, then scale confidently to stay ahead of competitors.
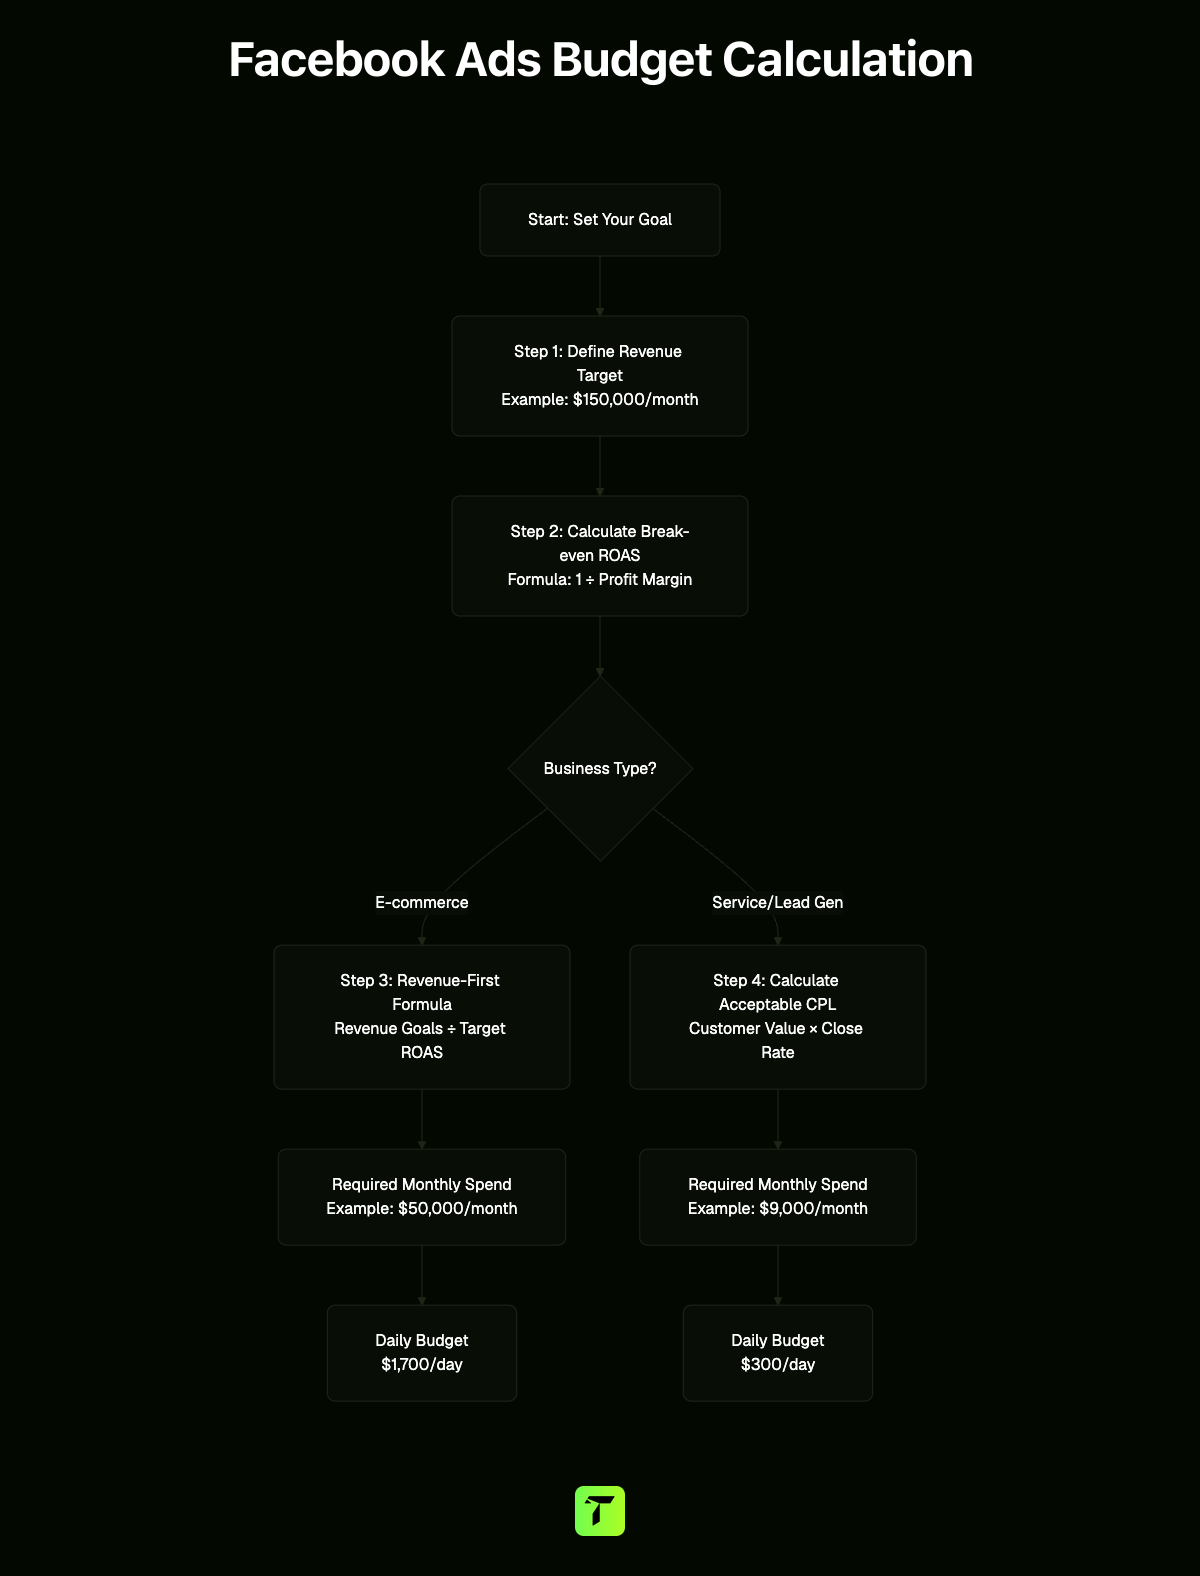
How to calculate Facebook ads budget using the reverse-engineering method
Budgeting without a plan wastes money. Instead, start with the revenue goal, work backward, and assign a budget that supports that outcome.
Step 1: define your revenue target or lead volume
Set a clear and specific goal. For example, aim for $150,000 in monthly revenue.
For service businesses, convert revenue into client count. If each client brings $3,000, and you want $30,000, then you need 10 new clients. Make these goals aggressive enough to promote growth but realistic enough to manage your workload or leads.
Step 2: calculate your break-even ROAS based on profit margins
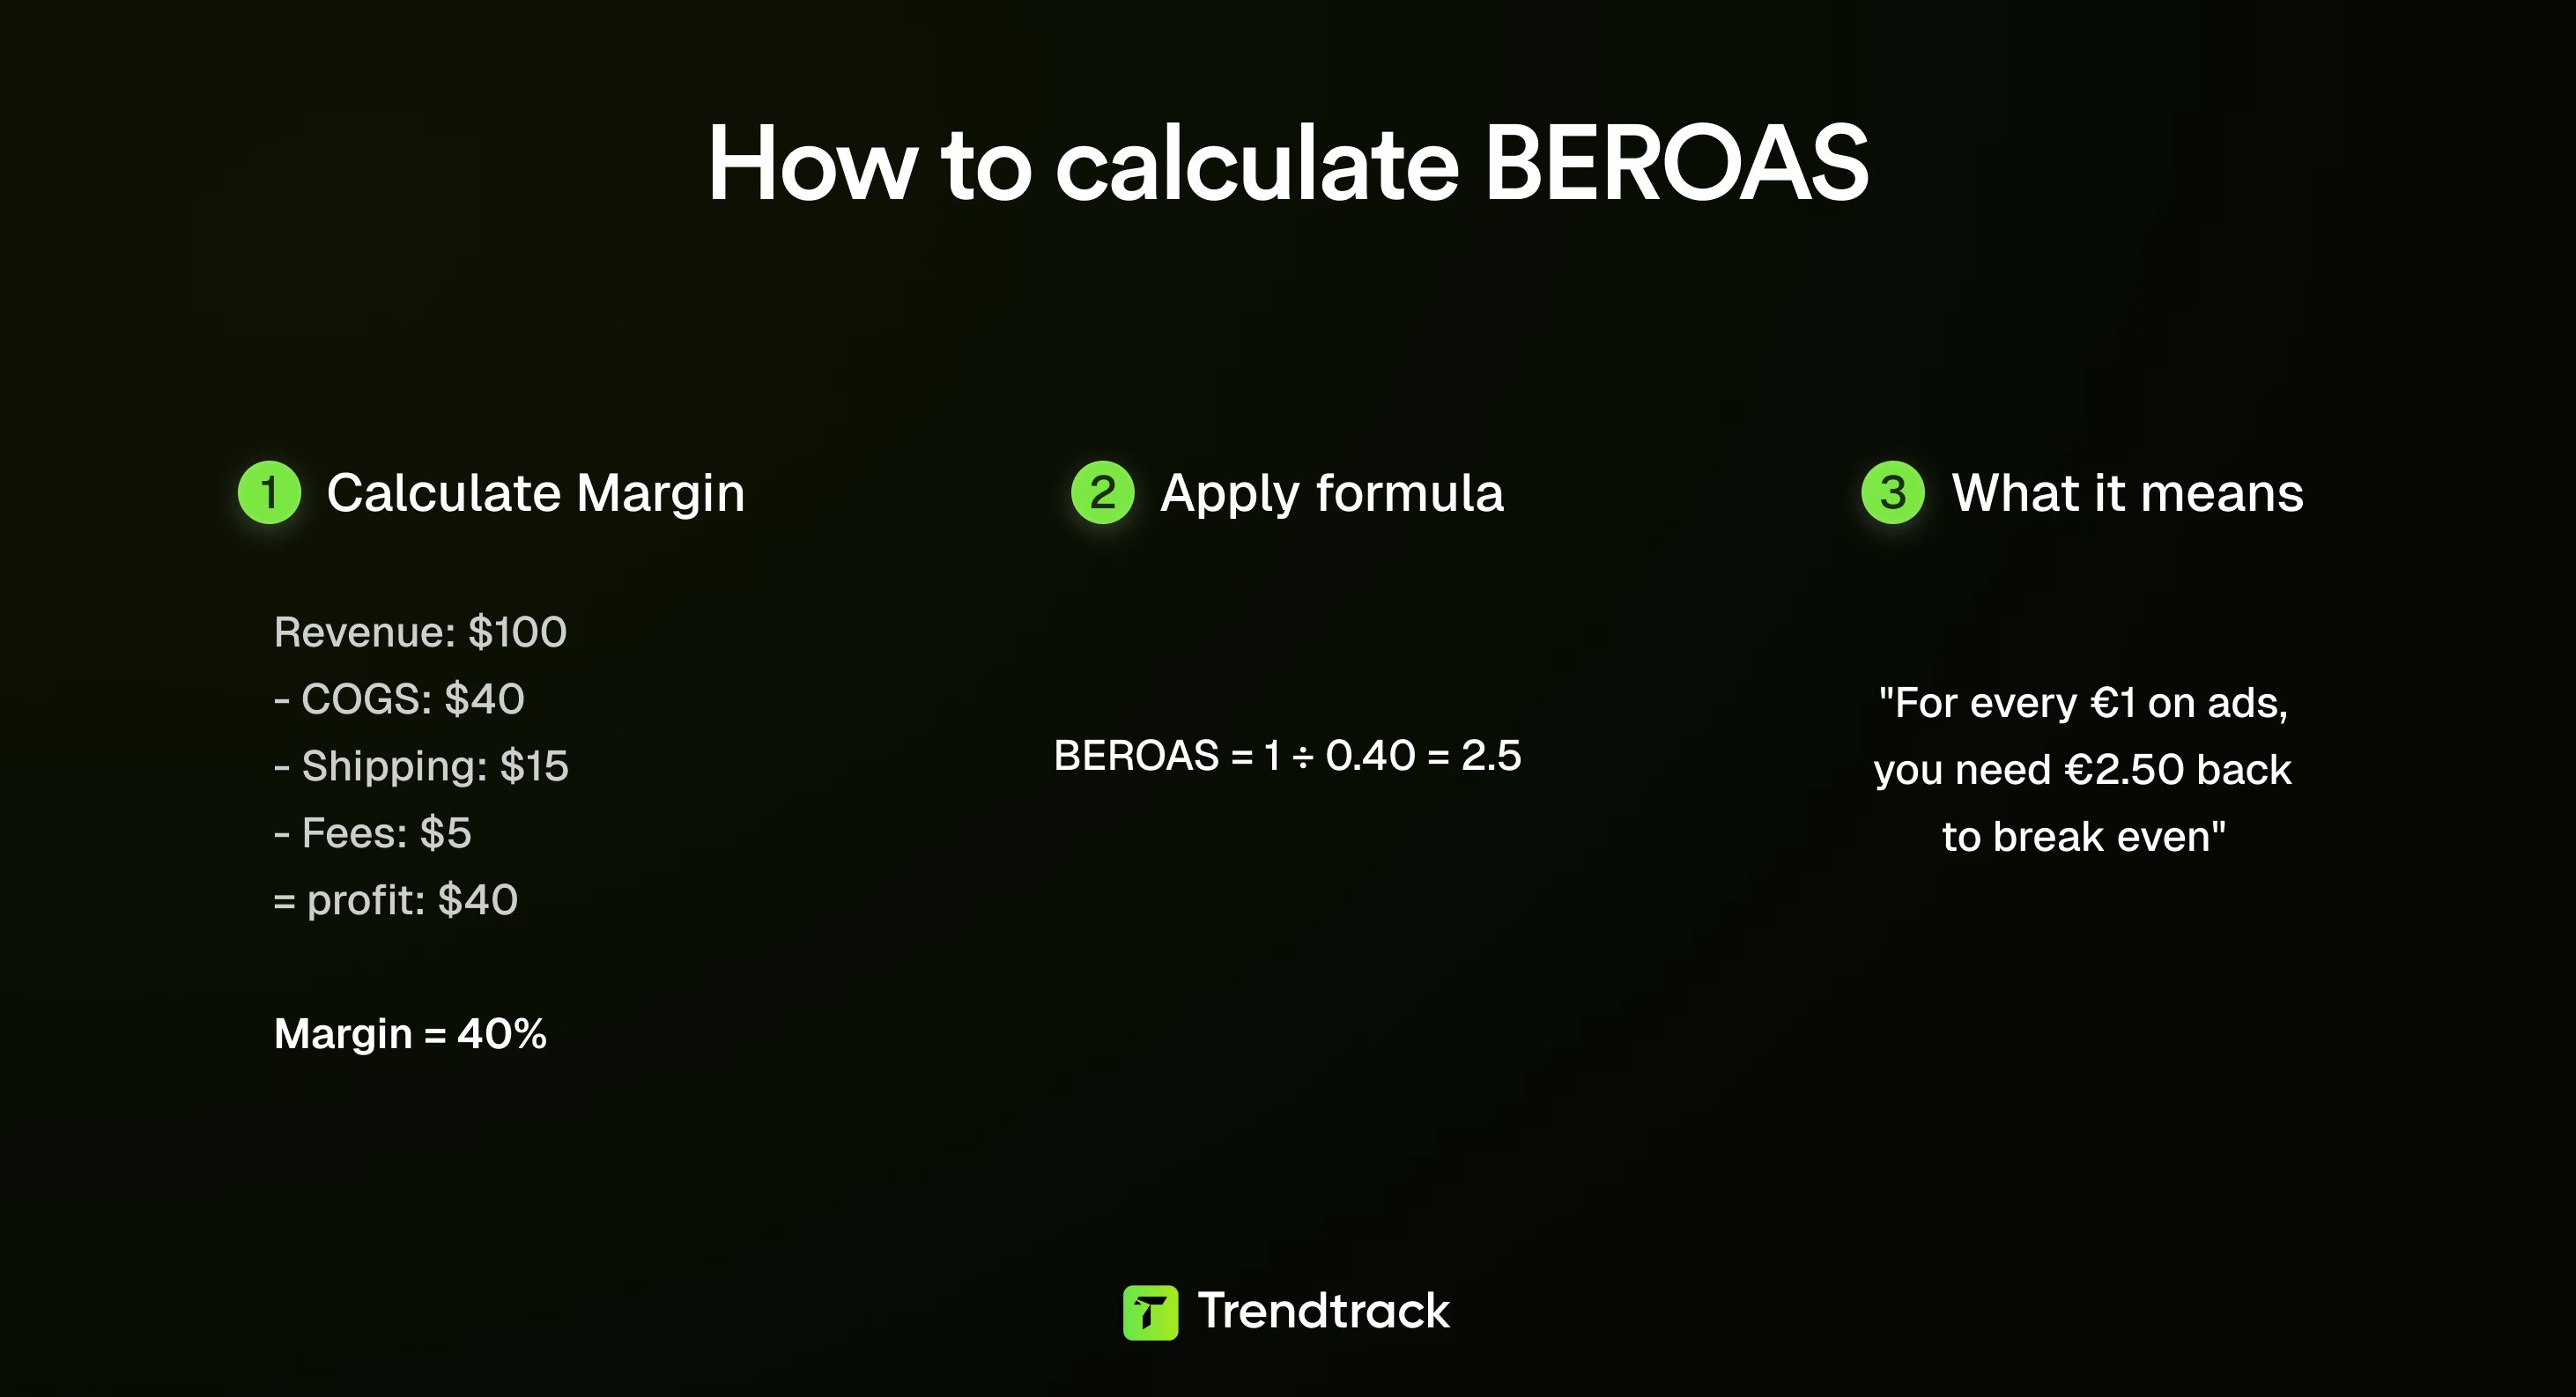
ROAS is a metric that measures how much revenue you generate for every dollar spent on advertising. It's calculated by dividing your total revenue from ads by your total ad spend, then multiplying by 100.
Break-even ROAS is the minimum return on ad spend you need to cover all your costs without making a profit or loss. It's calculated by dividing your total costs (product cost + operational expenses) by your revenue, then multiplying by 100.
Know your minimum Return on Ad Spend (ROAS) by calculating break-even ROAS:
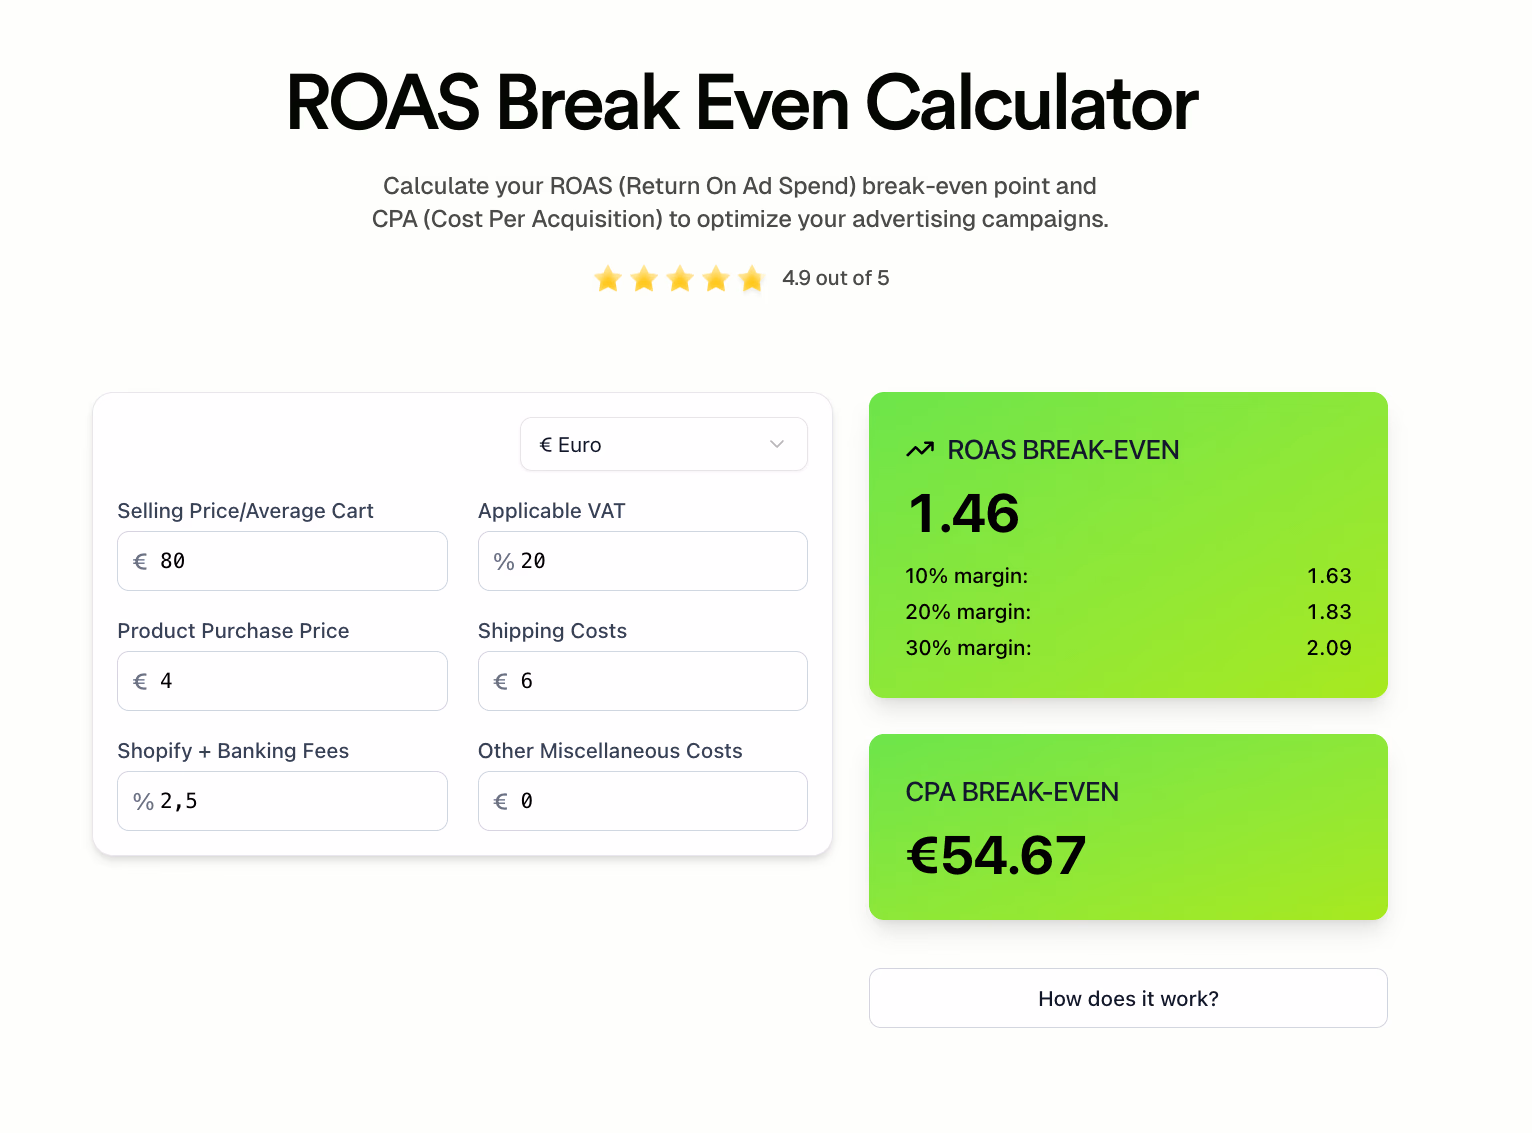
Break-even ROAS = 1 ÷ Profit Margin.
Examples:
A dropshipper with a $40 sale: product cost $20, shipping $8, fees $4.20, profit $7.80 (19.5% margin). Break-even ROAS is 5.13:1, so a 4.0 ROAS still loses money.
A brand with a $100 sale and a 67% margin has a break-even ROAS of 1.49:1. A 2.0 ROAS is profitable.
During testing, aim for 1.5 to 2 times your break-even ROAS. When scaling, target 2 to 3 times.
Want to skip the manual calculations? Use a break-even ROAS calculator to instantly determine your minimum return on ad spend based on your profit margins.
Step 3: use the revenue-first formula to find required spend
The revenue-first formula works backwards from your revenue goal. Divide your target revenue by your desired ROAS to determine exactly how much you need to spend on ads to achieve that goal.
Calculate how much you need to spend using:
Revenue Goal ÷ Realistic ROAS = Required Spend
For example:
Revenue Goal: $150,000
Target ROAS: 3.0
Required Spend: $150,000 ÷ 3 = $50,000/month (about $1,700 per day)
If you lack historical data, avoid guessing a high ROAS. Start with a practical test budget, such as $100 per day for 30 days ($3,000 total). Very low budgets, like $5 per day, won’t produce enough data to optimize.
Step 4: adjust for estimated conversion rates and CPA
Your conversion rate directly impacts how many ad clicks turn into actual customers. By factoring in your estimated conversion rate and CPA, you align your ad spend with realistic revenue expectations. This ensures your budget reaches the right scale to hit your ROAS goals.
For lead generation or service offers, calculate the budget based on your funnel:
Average Customer Value: $3,000
Acceptable Acquisition Cost: 30%, which is $900
Sales Close Rate: 10%, so you need 10 leads per sale
Acceptable Cost Per Lead (CPL): $900 × 10% = $90
If you want 10 clients, you need 100 leads. Multiply that by $90 CPL, and your starting budget is $9,000.
By selecting a revenue goal, you establish a clear target. Calculate your break-even ROAS from margins. Apply a realistic target ROAS to your business model. Factor in funnel metrics like CPA or CPL. This approach transforms guesswork into a budget with clear purpose.
Strategic budgeting approaches for different growth stages
You can’t use the same budget plan for a new store and an eight-figure brand. Your budget sends a signal to the algorithm: validate ideas with data instead of guessing.
Match your financial approach to whether you’re testing product-market fit or aiming to dominate a category. This keeps you ahead of competitors with less effort.
The 30-day consistency rule for new advertisers
New advertisers need data, not panic. Launching a campaign, seeing no sales in 48 hours, and pausing wastes potential and teaches the algorithm to ignore you. Commit to your budget and collect meaningful data.
Spend $100/day for 30 days, totaling about $3,000.
Lower budgets ($5–$10/day) won’t generate enough conversions to learn from.
See this as tuition: if losing $3,000 will break your budget, build organic traffic or improve creatives first.
Avoid distractions. Stop scrolling for hours, focus on signals, and let the pixel learn.
This approach trains your pixel and establishes a baseline. You launch with real data, not guesses.
The sustainable growth model for predictable revenue
When sales reach roughly $100k–$300k monthly, switch from broad spending to steady increases. Increase your budget by 10% every month to grow predictably.
For example, grow from $10,000 to $11,000, then $12,100 monthly.
Small increases prevent algorithm shocks and allow operations like fulfillment and inventory to scale.
This leads to steady growth and fewer drops in efficiency. It’s a practical way to double revenue year-over-year without damaging performance.
This strategy balances spending with revenue for consistent growth.
The aggressive scaling approach for rapid market penetration
Speed is critical sometimes like during viral momentum, Q4, or investor pressure. Use goal-based budgeting and prioritize volume over efficiency. Set clear revenue targets and spend accordingly.
Step 1: Define your revenue goal (e.g., $150,000/month).
Step 2: Use a realistic ROAS from past data (e.g., 3x).
Step 3: Calculate spend: Revenue ÷ ROAS = Required spend ($150,000 ÷ 3 = $50,000/month or about $1,700/day).
Expect ROAS to drop as you scale from $500/day to $1,700/day. This happens because your hottest audiences get exhausted and you need broader targeting. This is the Efficiency Paradox: more volume usually means lower ROAS.
To maintain aggressive scaling:
Increase creative testing to discover new winners.
Accept short-term inefficiency while you identify scalable ads.
If you can’t afford to spend more to find winners, stick to the sustainable growth model.
Summary roadmap:
New? Spend $100/day for 30 days without interruptions.
Growing? Increase budgets by 10% every month.
Scaling aggressively? Calculate spend by Target Revenue ÷ ROAS and accept lower efficiency for higher volume.
Analyze High-Performing Ads

Real-world budget calculation scenarios
You want numbers you can put directly into a spreadsheet, not theory. Budgets vary greatly: what bankrupts a dropshipper might be a slow day for a luxury brand.
Below are three real scenarios showing how to structure spending around your goals and margins. Use the right math, not noise, to match the strategies of the biggest DTC brands.
Scenario | Business Model | Revenue Goal | Target ROAS | Required Spend | Daily Budget | Key Constraint |
|---|---|---|---|---|---|---|
A: E-commerce | Premium Skincare | $150,000/mo | 3.0:1 | $50,000/mo | $1,700 | Margins support 3x ROAS |
B: Service | Consulting | $30,000/mo | N/A | $9,000/mo | $300 | CPL-based ($90/lead) |
C: Subscription | Coffee Sub | $50,000/mo | 9.6:1 LTV | $5,200/mo | $175 | Cash flow runway (3-6 mo) |
Scenario A: an ecommerce brand targeting 3x ROAS
Use the Revenue‑First Formula to reverse-engineer your spend.
Revenue goal: $150,000
Target ROAS: 3x (based on your historical data)
Required spend: $150,000 ÷ 3 = $50,000 per month (~$1,700 per day)
Always validate your target against your margins. For example:
Premium skincare: $100 sale, $33 total costs → 67% margin → break-even ROAS = 1 ÷ 0.67 = 1.49:1. A 3x target is comfortably profitable.
Dropshipper: thin margins (~20%) → break-even ROAS ≈ 5:1. A 3x target would lose money.
Rule of thumb: verify your break-even ROAS first. In testing, aim for 1.5–2× break-even; when scaling, aim for 2–3×. Let the math drive your spend, not hype, to get ahead of competitors.
Scenario B: a service business calculating acceptable CPL
For services or B2B, ROAS can mislead since sales cycles stretch out. Budget from the sale back to the lead.
Here’s how:
Average client value: $3,000
Acceptable acquisition cost: 30%, so $900
Sales close rate: 10%, meaning you need 10 leads per client
Max CPL: $900 × 10% = $90
If you want 10 new clients, plan for 100 leads × $90 CPL = $9,000 per month. For a minimal test, aim for one client: $900 budget to acquire about 10 leads, expecting 1 close.
This approach enforces discipline: validate ideas without guessing. Stop endless scrolling—analyze funnel metrics and use conversion data to see if the CPL is sustainable.
Scenario C: a subscription model focusing on LTV and cohorts
Front-end ROAS often looks weak for subscriptions. Budget based on cohorts and lifetime value.
Coffee subscription example:
Product price: $30
Cost of goods sold plus shipping: $20
Ad spend per customer (CPA): $25
First order: you spend $45 (costs + ads) and earn $30, a loss. First-order ROAS relative to ad spend is $30 ÷ $25 = 1.2:1, which seems low. But if average retention is 8 months, lifetime revenue equals $240, turning that $25 acquisition into a lifetime ROAS of 9.6:1.
Use cohort analysis to budget:
Month 1: ROAS might be 0.9:1 (loss)
Month 3: ROAS around 2.1:1 (near break-even)
Month 6: ROAS approximately 4.5:1 (profit)
Month 12: ROAS about 8.2:1 (strong profit)
Your main constraint is cash flow runway. You must finance the customer acquisition cost valley, typically 3–6 months, while cohorts mature. Model how long it takes for cohorts to become profitable to launch with confidence and real data.
Apply these calculations to your numbers. Validate assumptions, verify break-even, and set a spend that drives results. If you lack historical data, run disciplined tests instead of guessing.
Validate ideas step by step before scaling. Install the Trendtrack Chrome extension to monitor ad volume and spend changes as they happen.
Install Our Free Chrome Extension
Analyze any Shopify store you visit with our powerful browser extension. Get instant insights on traffic sources, visitor volume, themes, and apps.
Using Trendtrack to benchmark and validate your budget
Stop guessing your numbers or spending hours scrolling. Trendtrack changes budget decisions from guesses to calculated moves. It lets you validate assumptions with real market data and learn from the biggest DTC brands. Launch your campaigns with confidence using accurate information.
Analyzing competitor ad scaling signals to estimate spend
You can't see a competitor’s bank account, but their ad behavior reveals what works. They increase spending on ads that perform and pause those that lose money.
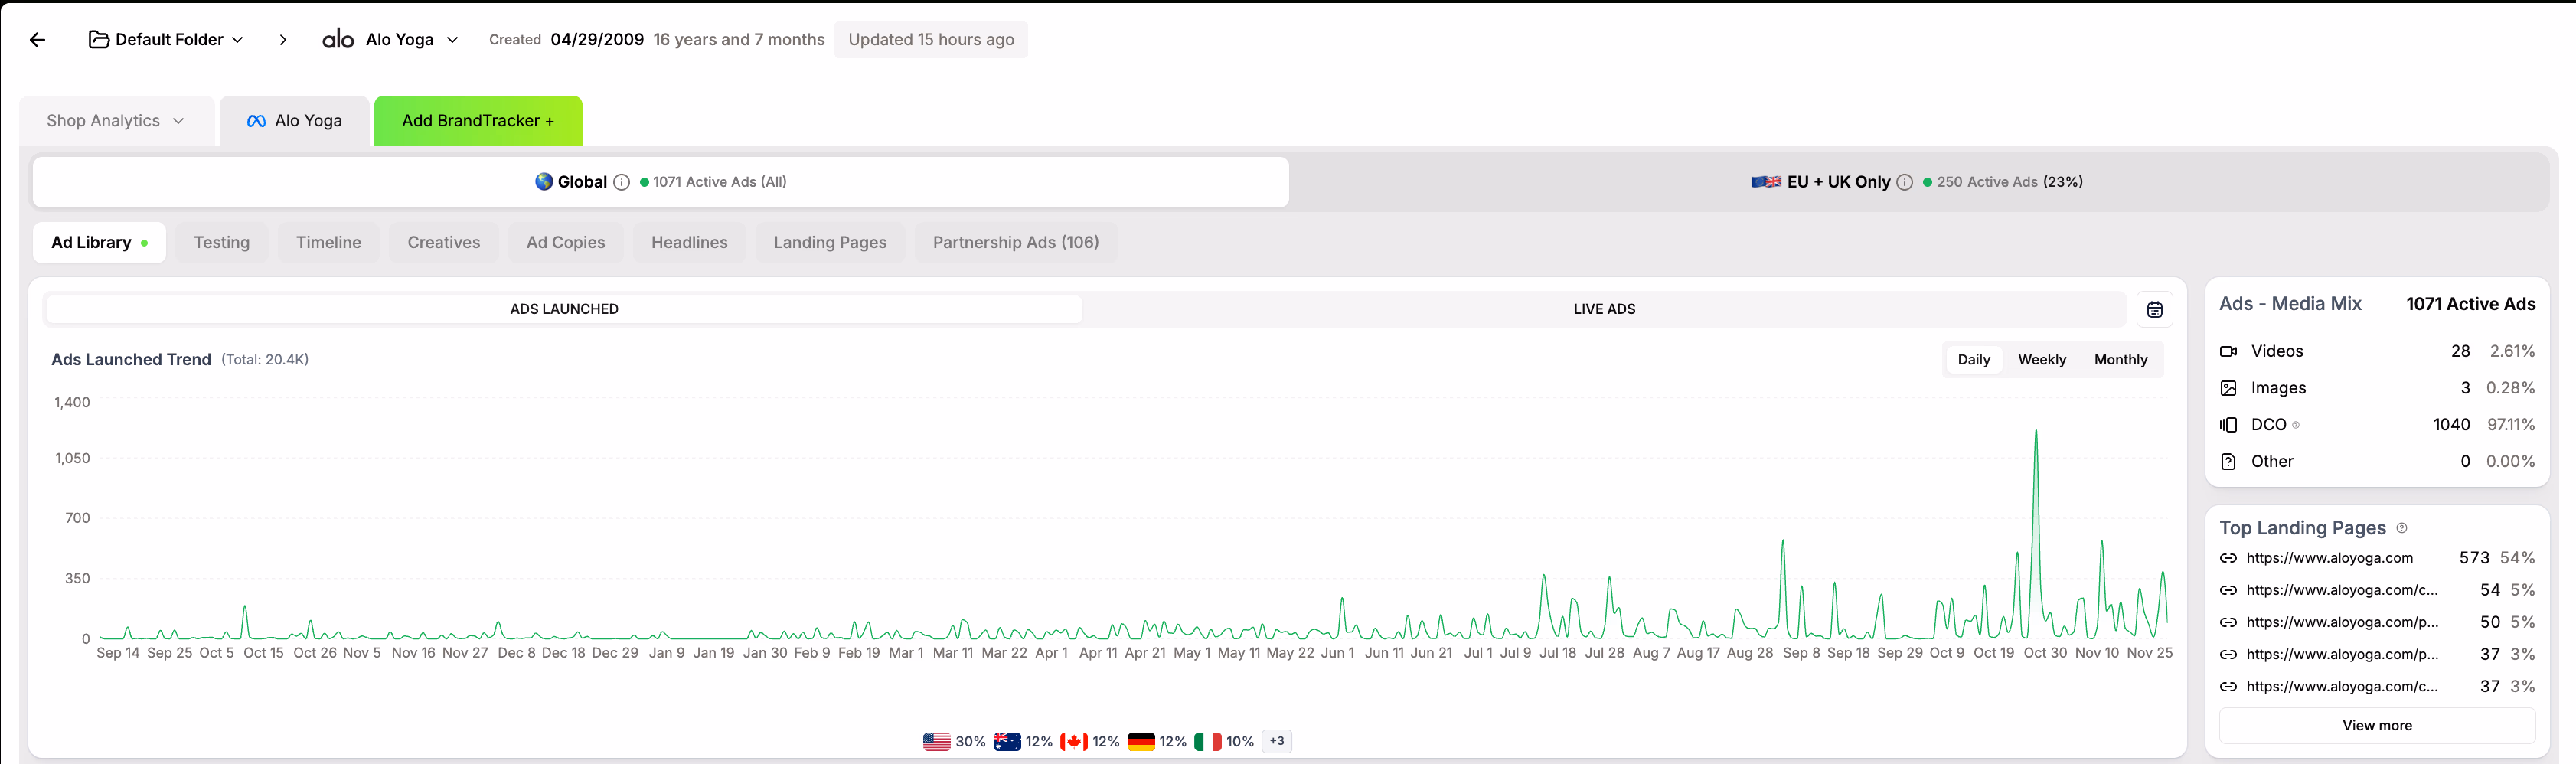
Use Brandtracker’s “Ads Launched Trend” to track ad count over time.
A rise from 20 to 80 active ads over 60 days, accompanied by increasing traffic, is a clear scaling signal.
Flat or decreasing ad counts combined with frantic creative tests usually indicate struggles.
In EU/UK markets, Trendtrack filters ads by real spend and reach. For example, ads spending $1,000 or more in the last 7 days show serious investment. Competitors consistently backing a creative angle with four-figure spends offer a real benchmark.
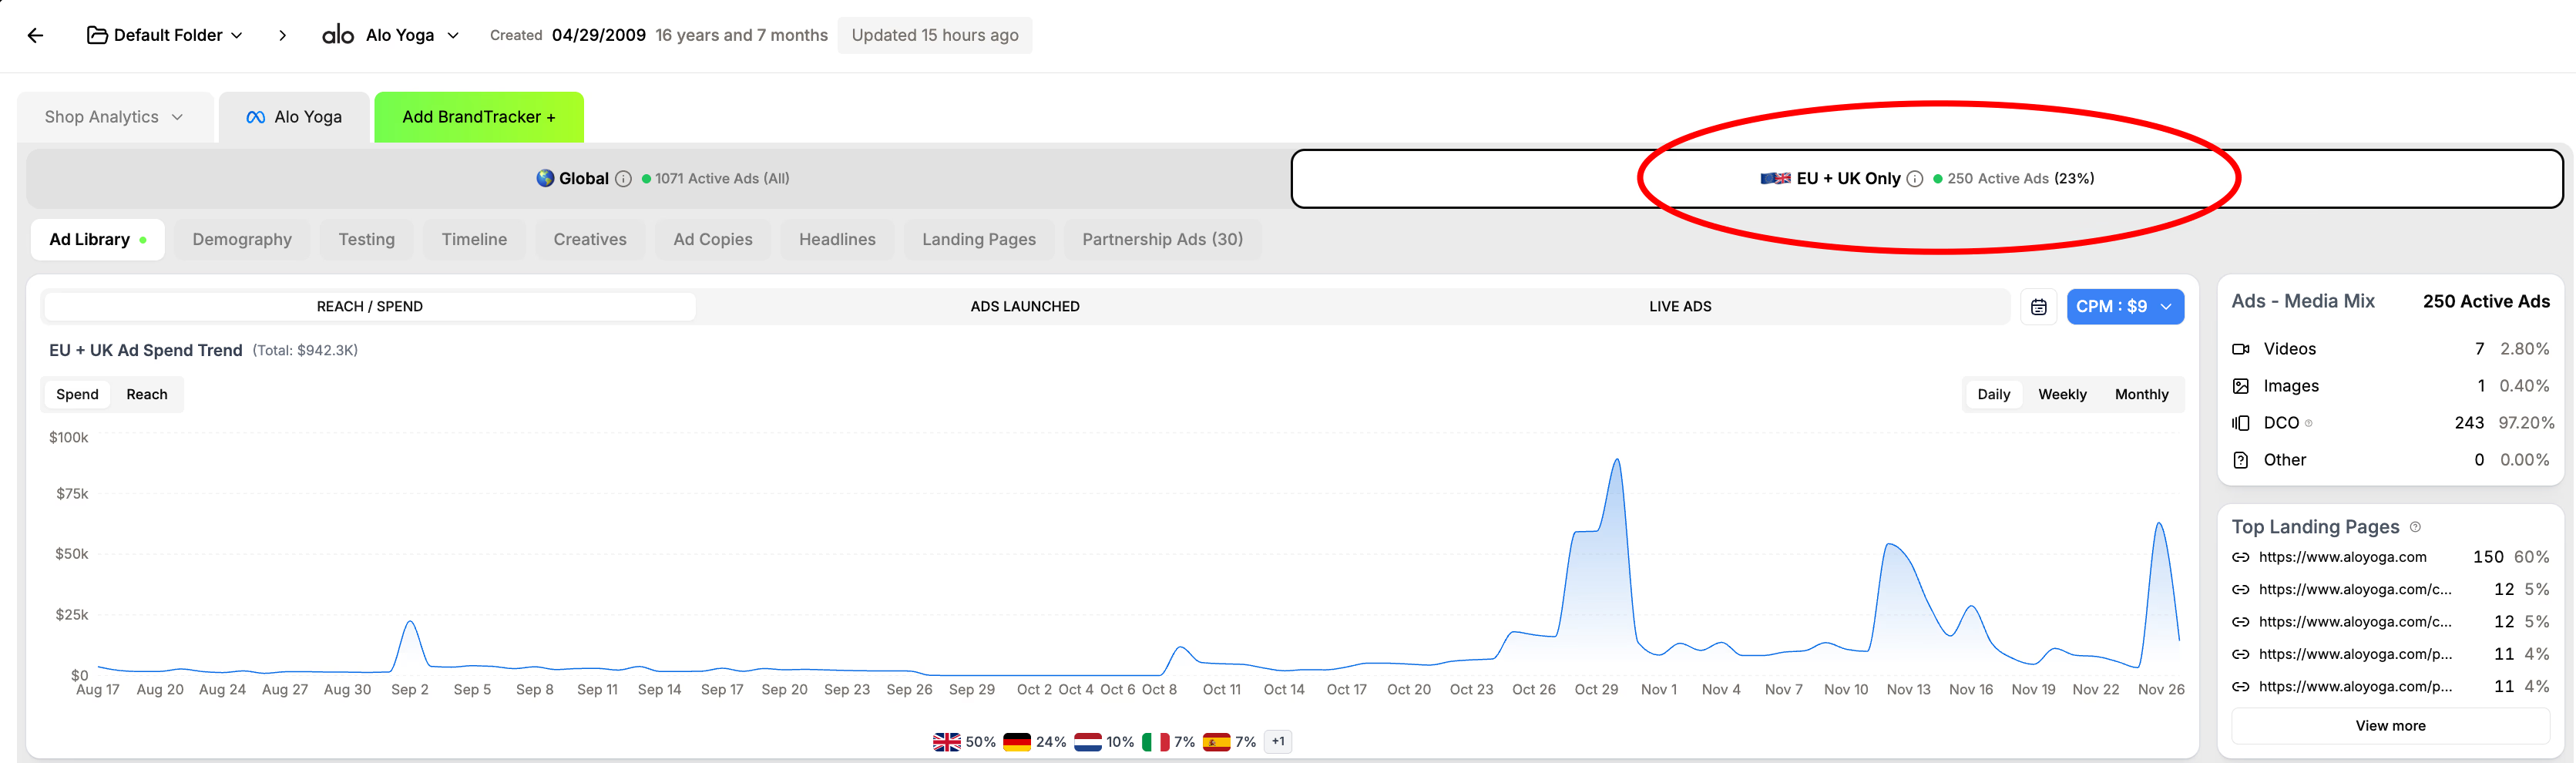
By watching visible spend and ad volume, you can set realistic starting budgets and get ahead of your competitors.
Comparing your target ROAS against industry averages
We mentioned that the global average ROAS for 2025 is 2.19:1. However, vertical medians provide better guidance. Use Trending Shops to filter by category and compare market leaders:
Baby products: about 3.71:1
Luxury goods: around 3.70:1 or higher
Health and beauty: near 2.82:1
Dropshipping: roughly 2.0:1
These medians show typical performance. Top performers often achieve two to three times these results. When competitors scale aggressively, benchmark against category leaders rather than basing your budget on weaker ROAS.
Want to go beyond budgeting? Learn specific tactics for maintaining efficiency as you increase spend by reading how to improve ROAS as you scale.
Reverse-engineering successful stores to set realistic goals
You can use Trendtrack data to reconstruct a competitor’s budget approach and model your own spending.
Start by identifying volume with Brandtracker by checking total active ads and media mix. More than 50 active ads indicates a sustained testing budget.
Next, look at unit economics using Trending Shops to find best-seller prices.
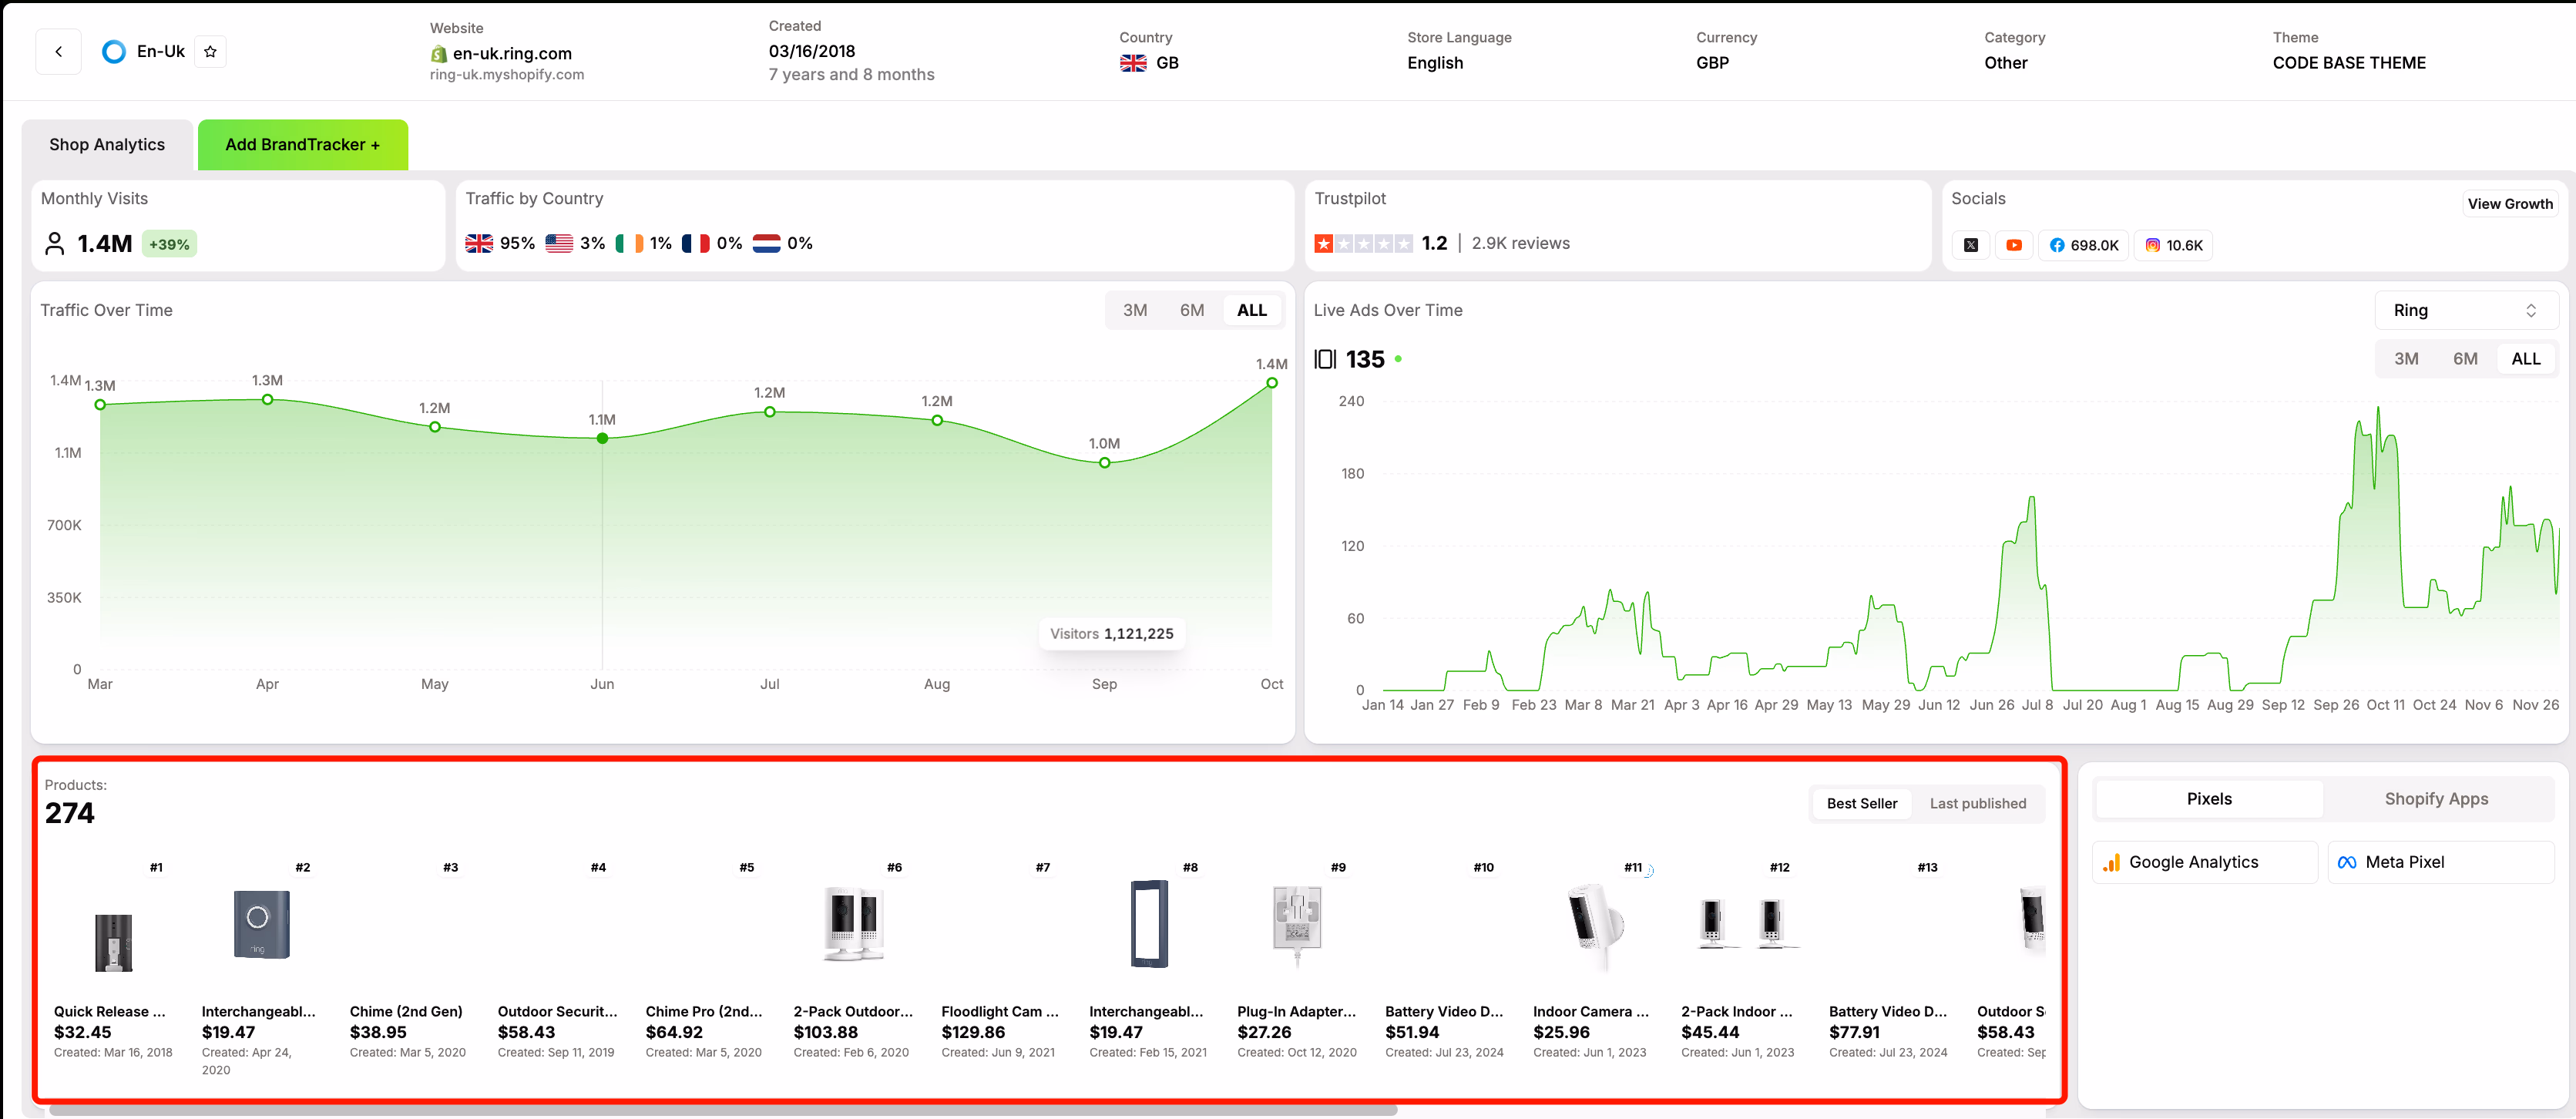
Estimate margins by inferring product costs through Shopify Apps or Theme filters and typical cost of goods sold assumptions.
Calculate your goal by combining price and margin with observed ad intensity. This helps estimate the competitor’s break-even ROAS and likely spend.
Use “Traffic Growth” and “Ads Growth” filters together. If multiple competitors keep high ad counts while traffic rises, their spend is likely sustainable. Model your initial budget to match their ad intensity so you can compete effectively.
Use Trendtrack to benchmark, reverse-engineer, and set budgets that reflect real market behavior without guessing.
Reverse-Engineer Successful Stores
Learn exactly what makes top Shopify stores successful. Analyze their traffic sources, apps, themes, and best-selling products to replicate their success.
How to scale your budget without losing efficiency
Scaling requires discipline. Increasing your budget from $10/day to $100,000/day depends more on process than complexity. Doubling your budget overnight without a plan wastes money. Focus on increasing volume while preserving margin to stay ahead of competitors.
The 10% month-over-month increase rule
Avoid quick, unsustainable hacks that double your budget every day. A steady 8–10% monthly increase supports consistent growth without disrupting the algorithm or overwhelming operations.
For example:
Month 1: $10,000
Month 2: $11,000 (10% increase)
Month 3: $12,100 (10% increase)
This approach works well once you reach $100,000 to $300,000 in monthly revenue. Below $100,000, faster scaling can be possible with the right creatives, but the 10% rule helps avoid sudden drops in efficiency. Build confidence by compounding budget increases based on real data.
Why ROAS typically decreases as you scale spend
Expect a decline in ROAS as your budget grows. At low spend levels, Meta finds the easiest conversions. Expanding your budget reaches colder audiences, which are less efficient.
Balance volume and efficiency:
A 5:1 ROAS on $1,000 generates $5,000 in revenue
A 2.5:1 ROAS on $50,000 generates $125,000 in revenue
Higher spending can yield more profit despite lower ROAS. Constantly test new creatives to control costs. Focus on metrics that matter and avoid wasting time chasing noise.
Monitoring POAS to ensure true business profitability
ROAS measures revenue but not profit. POAS (Profit on Ad Spend) accounts for costs: Gross Profit divided by Ad Spend.
Consider this example with T-shirts:
Price: $30 × 30 shirts = $900 revenue
Product cost: $18/shirt = $540
Shipping: $4/shirt = $120
Fees: $45
Ad spend: $300
Total cost is $1,005, resulting in a $105 loss despite a 3:1 ROAS. POAS reveals this gap clearly.
Aim for:
About 2:1 POAS for sustainable growth
Above 3:1 POAS when scaling aggressively
Ignore vanity metrics. Scale based on real profit.
Adjusting budget allocation for seasonal fluctuations
Demand changes throughout the year. Q4 often sees ROAS climb to 3.5–5:1, while January and February drop to about 1.8–2.2:1. Use seasonality strategically:
Save cash during Q4 to cover slower months
Test creatives and refine funnels in lower-demand periods when CPMs are cheaper
Increase spend during peak seasons with proven creatives
This strategy helps manage the “CAC valley” and maintain momentum despite seasonal changes. Validate ideas deliberately, then scale confidently.
Scaling requires discipline, accepting some ROAS decline, tracking POAS, and planning for seasonality. Focus on testing, applying data, and prioritizing profit. Don't guess, use tools like Trendtrack to benchmark against competitors and set realistic targets from day one.
Conclusion
Your Facebook ads budget isn't a gamble. It's a formula. Work backward from your revenue goals and understand your true break-even points. This turns ad spend into a predictable growth engine.
Start with a test budget you can afford to lose. Validate your creative winners. Scale only when the data proves it's profitable. The math doesn't lie. Run the numbers. Trust the process. Let your budget fuel your business growth.


.avif)


Are you ready to get the insights?
From viral trends to million-dollar stores — unlock the insights behind what sells, scales, and converts. All in one place.