How to Analyze Shopify Stores for Maximum Growth


It is not wrong to say that most of the ecommerce entrepreneurs analyze their Shopify stores like they're checking the weather. A quick glance at revenue numbers, maybe conversion rates if they're feeling thorough.
Meanwhile, some of the stores calculating everything. The difference isn't access to better data. It is knowing how to analyze Shopify stores with the precision of a forensic investigator.
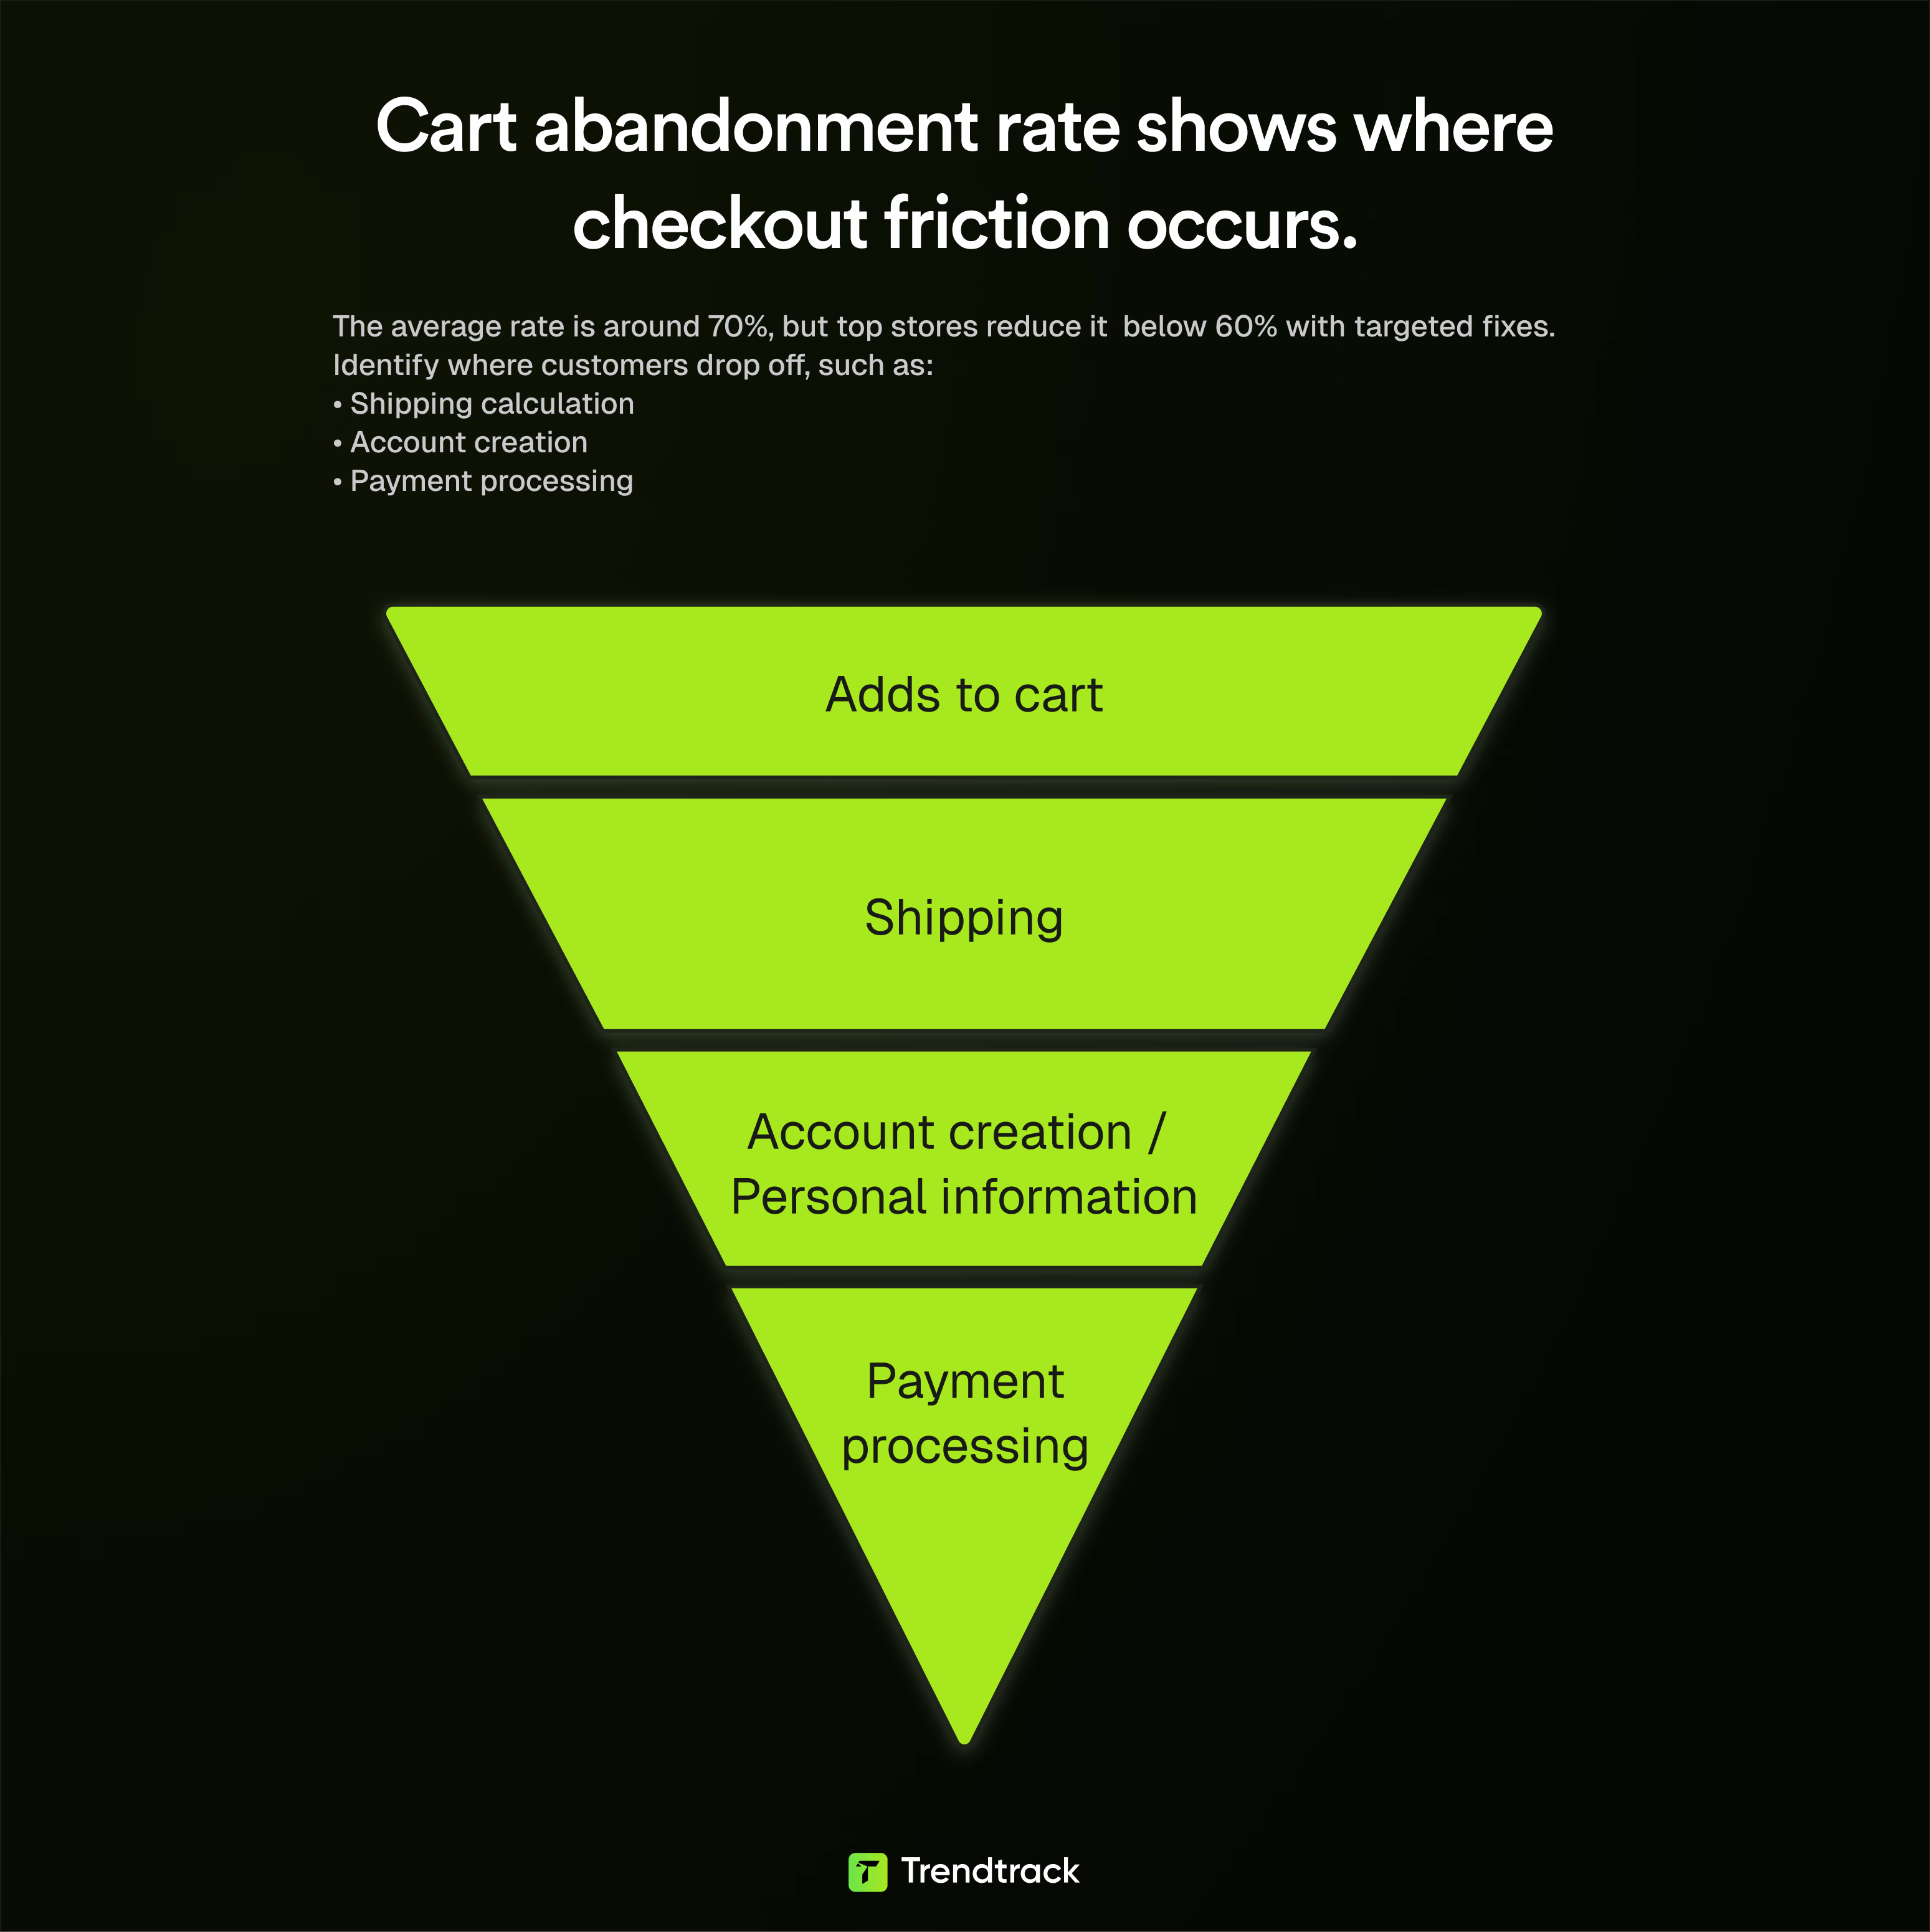
When you understand that your checkout process loses 70% of visitors, you stop guessing and start scaling with precision.
How to Analyze Shopify Stores for Performance and Growth
Key Metrics to Track in Your Shopify Analytics
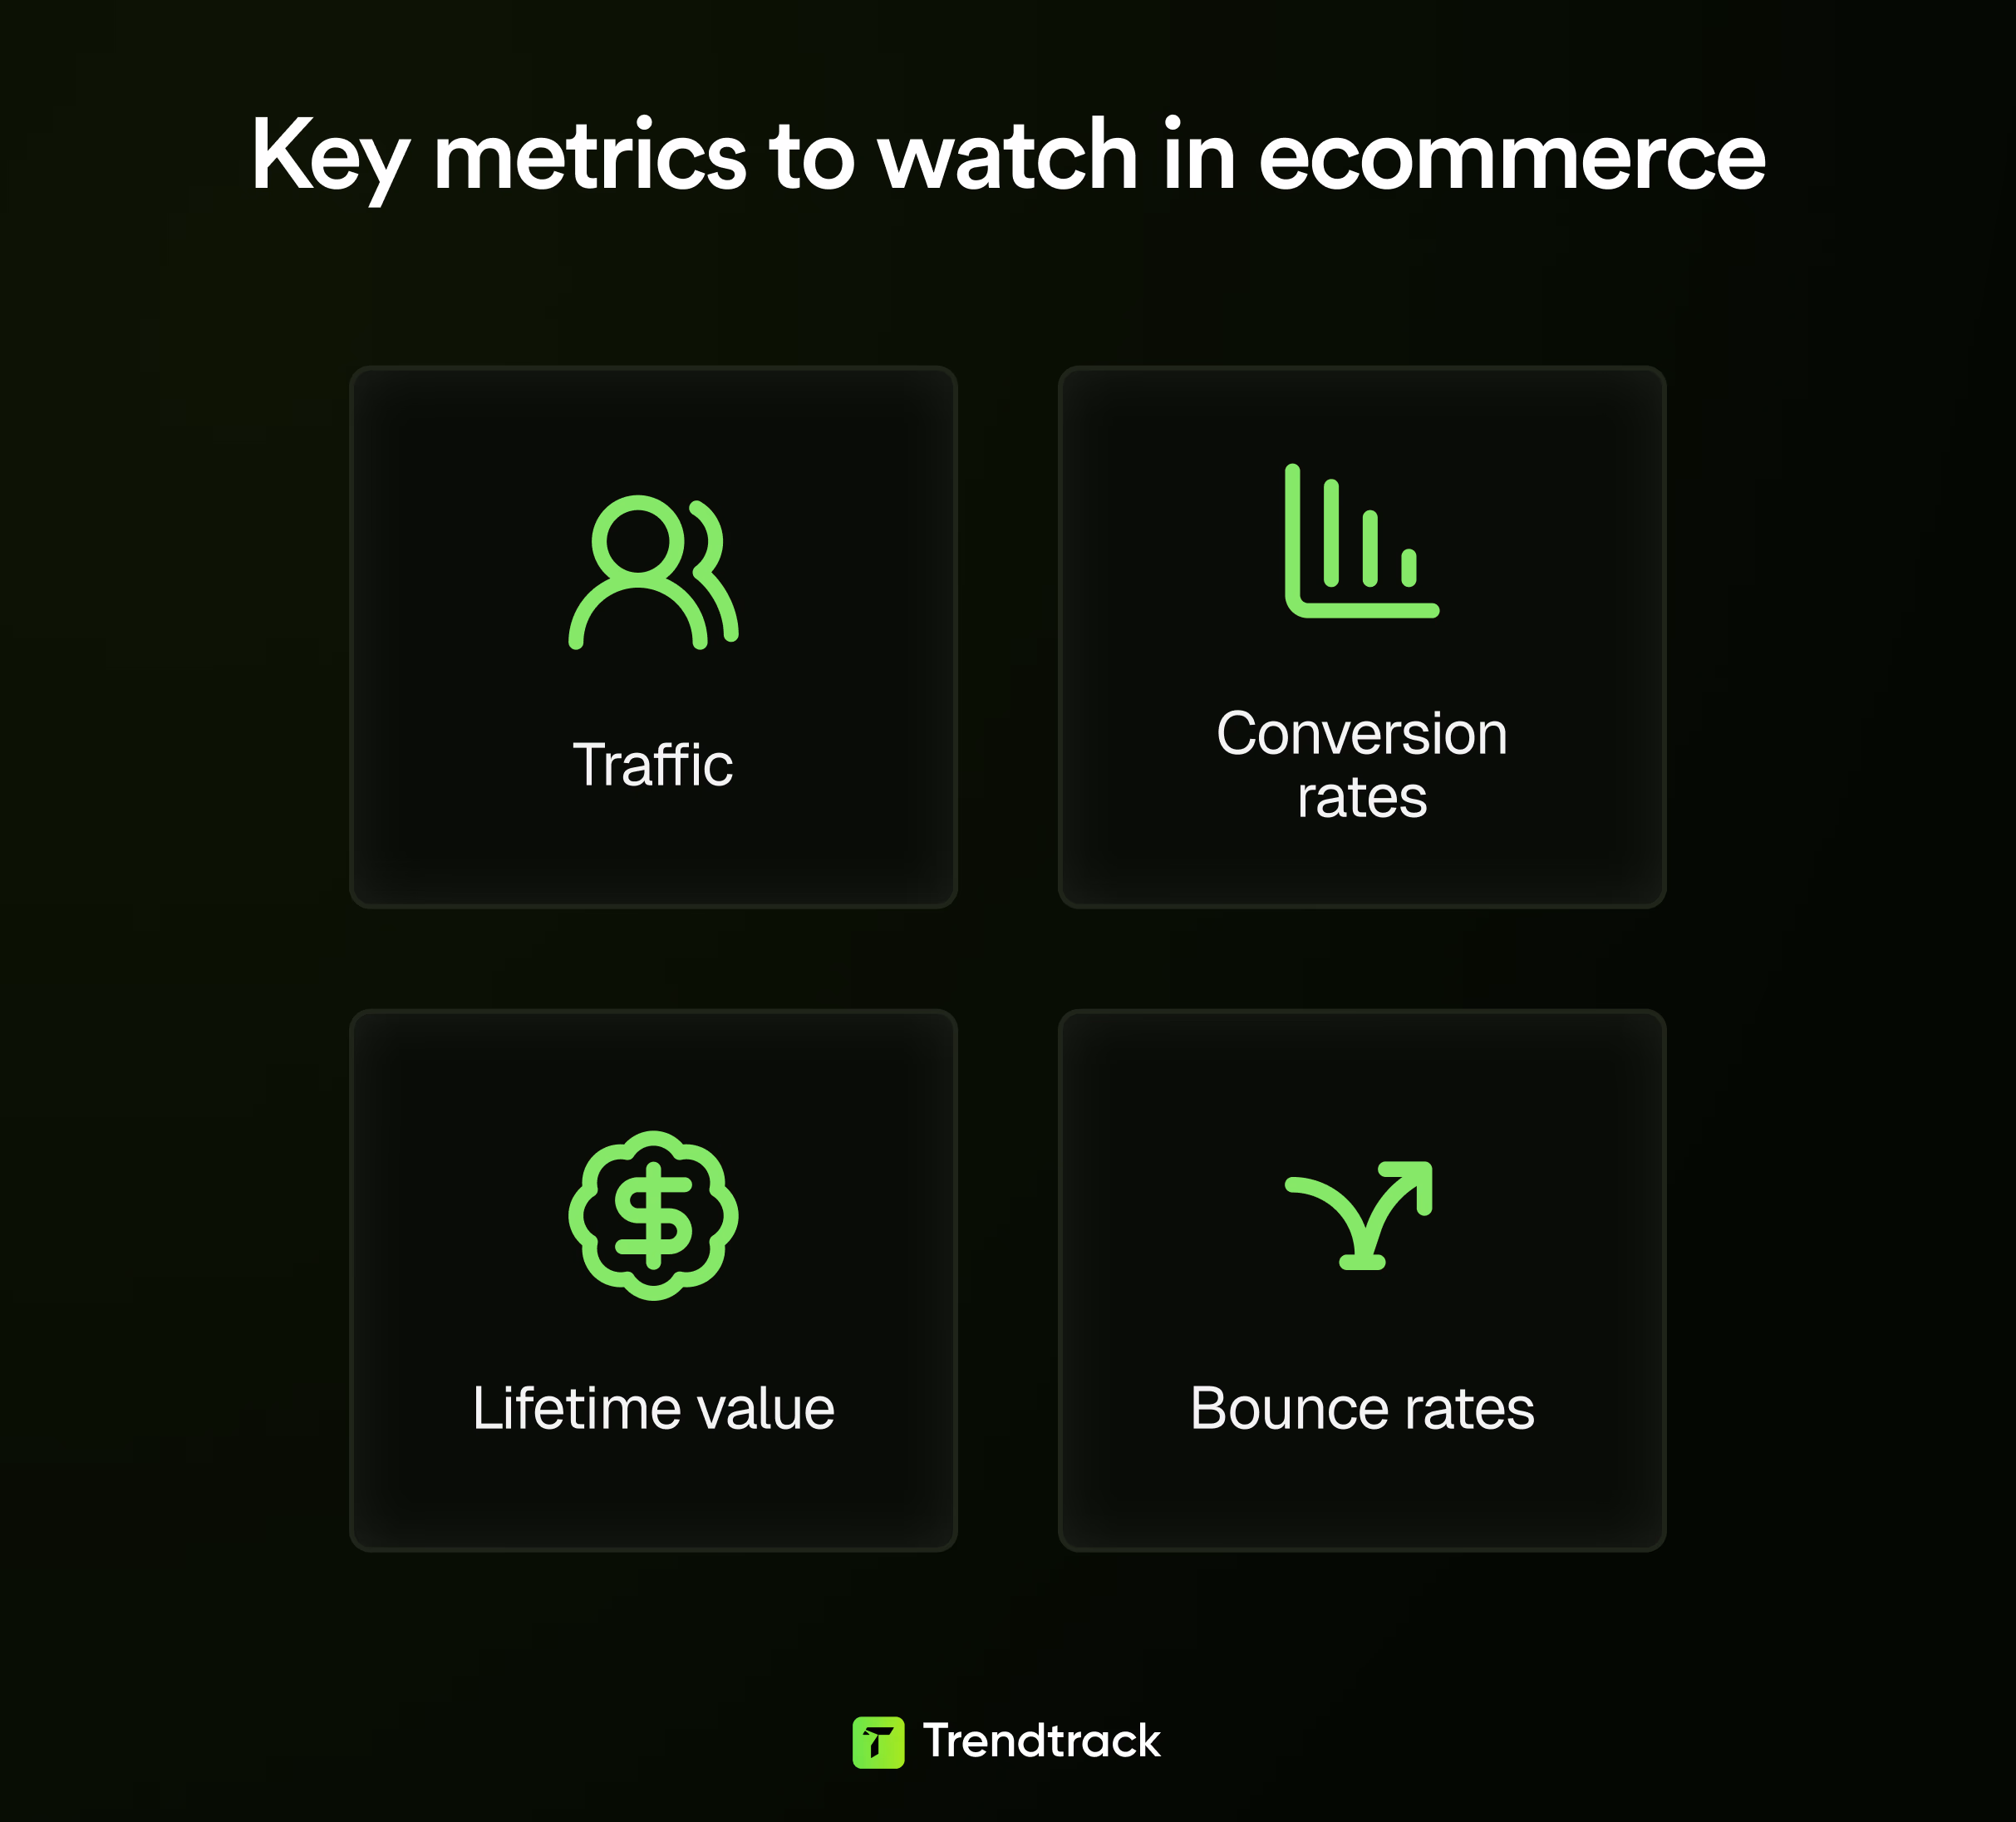
Your Shopify store generates a large amount of data daily. The challenge is identifying which numbers truly impact your business.
For example, a fashion dropshipper might focus on average order value but miss insights from the return visitor rate. A subscription box service could concentrate on new customer acquisition and overlook costly churn.
Start with conversion rate, but analyze it beyond the overall figure. A 2% conversion rate means different things for a $20 impulse buy versus a $2,000 luxury item. Break it down by:
- Traffic source
For $2,000 product:
For $20 product:
- Device
- Time of day
You might find mobile visitors from Instagram convert at 4% on weekends but only 1% during weekdays. This insight helps you stay ahead of competitors.
Customer Lifetime Value
Customer lifetime value (CLV) reveals your business's true health. Calculate it by multiplying average order value, purchase frequency, and customer lifespan. If your CLV is $150 but you spend $200 to acquire each customer, you are losing money.
Product Pages Are Crucial
Look at time on page and bounce rate together. A high bounce rate with low time on page suggests you attract the wrong audience or run misleading ads. High time on page but still a high bounce rate may indicate pricing issues or missing calls to action.
Session duration and pages per session measure visitor engagement. Leading stores see visitors browse 4-5 pages and spend 2-3 minutes per session. Lower numbers may signal navigation or product discovery problems. Higher numbers could mean visitors are confused or struggling to find what they want.
Save Hours of Research Time
Stop checking five different tools. Trendtrack provides better insights in one platform. Save time and streamline your research workflow.

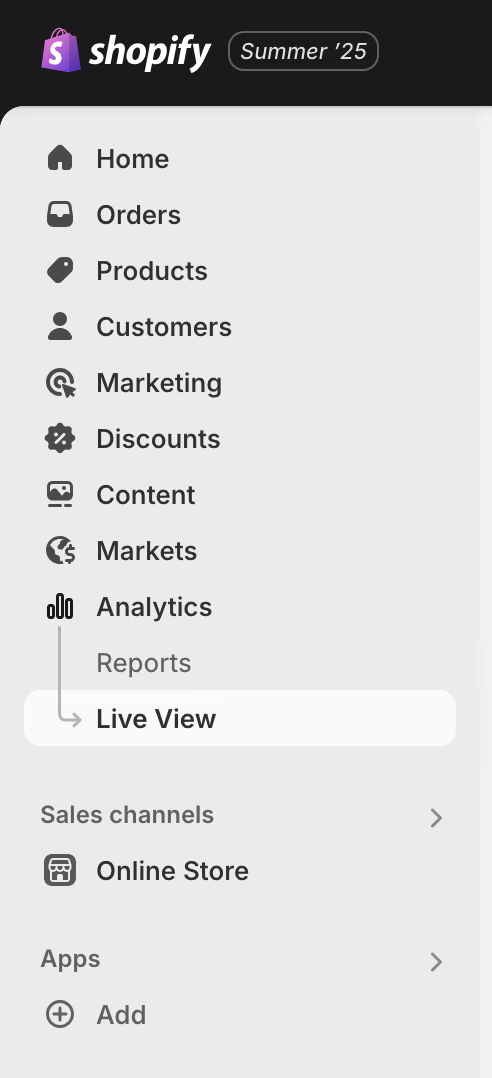
Using Shopify's Built-in Reports for Actionable Insights
Shopify’s Analytics dashboard offers many pre-built reports, but most store owners use only a few.
The Live View feature shows real-time visitor behavior. Look for patterns, such as products frequently viewed together. This signals opportunities for bundles or cross-sell offers.
The Sales by Product report becomes more useful when filtered by date ranges. Compare this month to the same month last year to account for seasonality. A product that seems to be failing might just be out of season, while a top seller could be a short-term trend.
Traffic reports reveal more than visitor counts. The referral sources section shows which marketing channels bring buyers, not just browsers. You might find Pinterest drives traffic but no sales, while a niche forum delivers your highest-converting visitors. This helps validate marketing strategies.
How to Benchmark Your Store Against Industry Standards
Benchmarking without context is ineffective. A 3% conversion rate may be excellent for high-ticket items but average for low-cost accessories. Your industry and niche matter.
General ecommerce conversion rates range from 1-3%, with top stores reaching 5% or more. By category:
- Fashion: around 1.4%
- Health and beauty: about 2.9%
- Food and beverage: up to 4.6%
Always compare yourself to your specific niche, not broad averages.
Average order value (AOV) varies widely by product and audience. For example:
- Fashion stores: $100-150
- Electronics: $200-300
- Fast fashion: $40-60
- Premium fashion brands: $300+
Look at direct competitors for accurate comparisons.
Mobile Versus Desktop Performance Gaps Present Opportunities
Mobile usually converts at 50-70% of desktop rates. The best stores close this gap with optimized mobile experiences. If your mobile conversion rate is less than half your desktop rate, prioritize mobile improvements.
Email marketing benchmarks provide clear indicators:
- Open rates: 25-40%
- Click rates: 2-3%
- Abandoned cart recovery: 10%
If your numbers fall below these, improve your email strategy. If above, focus on scaling what works.
Customer acquisition cost (CAC) varies by business and growth stage. Established brands spend $50-100 per customer; new stores often pay more. Aim for a CAC to CLV ratio of at least 3:1 for sustainable growth.
Page load speed impacts conversions. Each extra second costs about 7% in conversions. Top stores load pages in under 3 seconds on desktop and under 5 seconds on mobile. Use Shopify’s Web Performance report to identify and fix slow pages, starting with high-traffic ones.
Return visitor rate benchmarks depend on product type. Consumables should see 15-20% of visitors return within 30 days. Durable goods might only see 5-10%. Compare your rate to similar products to avoid misleading conclusions.
Want to stay ahead of viral trends? Learn how to identify trending products on TikTok before your competitors catch on. It's often where the next big opportunities emerge.
Summary
Metric | Benchmark | Tip |
|---|---|---|
CR | Fashion: 1.4%Beauty: 2.9%F&B: 4.6% | Compare by niche, not general eComm. |
AOV | Fast fashion: $40–60Premium: $300+ | Match with competitors in your price tier. |
Mobile CR | 50–70% of desktop | Below 50%? Fix mobile UX. |
Opens: 15–25%Clicks: 2–3%Cart recovery: 10–15% | Improve or scale depending on results. | |
CAC | $50–100 (established) | Aim for 1:3 CAC:CLV ratio. |
Load Speed | <3s (desktop), <5s (mobile) | Every 1s delay = ~7% fewer conversions. |
Return Rate | 15–20% (consumables)5–10% (durables) | Only compare within product type. |
Analyzing Competitor Shopify Stores with the Help of Trendtrack
Analyzing your competitors goes beyond simply visiting their storefront. It requires a structured breakdown of their performance, marketing, and customer experience.
By combining research with tools like Trendtrack.io, you can reverse-engineer what’s working and identify opportunities to outperform them.
Find the Right Competitors
Start with stores targeting your same audience and price tier. Use clues like:
- Referral traffic in your Google Analytics: Are niche blogs or influencers sending traffic to your site? They’re likely also promoting your competitors.
- Customer behavior on social media: When users tag your brand, check who else they’re engaging with. This reveals cross-brand shopping behavior.
- Search trends: Look at secondary keywords your customers might use. If you sell yoga mats, don’t just watch “yoga mat” competitors—explore stores ranking for “meditation cushion” or “pilates bands.”
Once identified, avoid analyzing Amazon-sized giants. Focus on mid-tier brands with 50–500 products. These are optimized enough to learn from, but still relatable in scale.
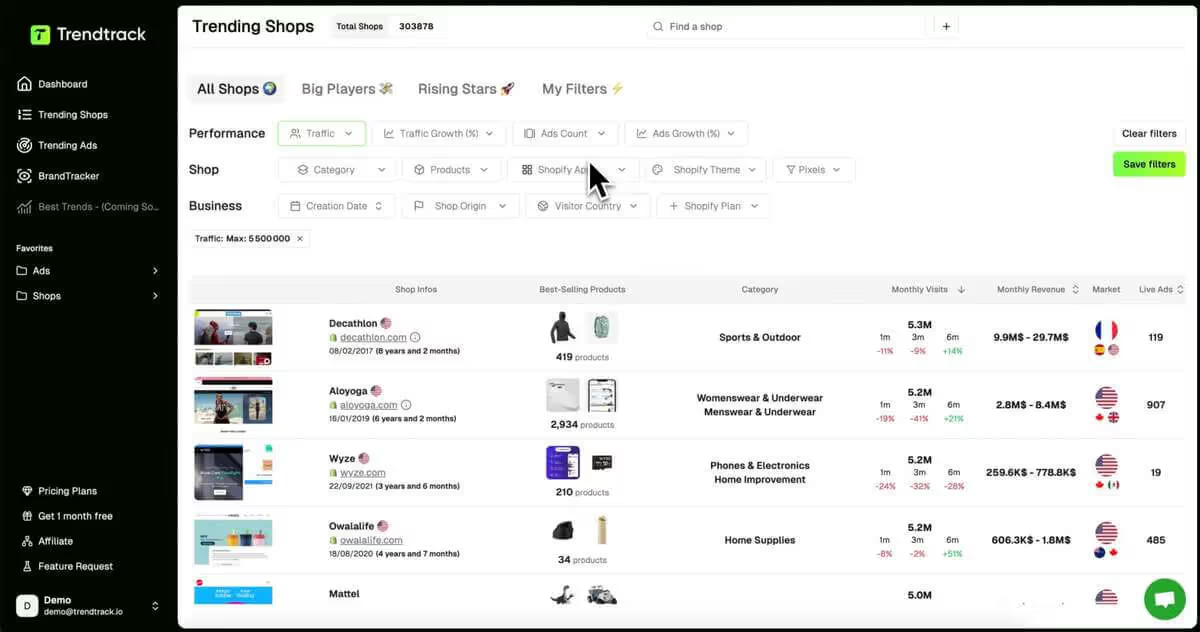
Analyze with Trendtrack.io
Trendtrack supercharges your research. It reveals hidden details about traffic sources, revenue range, tech stack, ads, and creative direction.
Monthly Visits
This metric shows how much traffic a store attracts and whether it’s increasing or declining. For example, a store with 2.5M visits per month and 18% month-over-month growth is clearly scaling.
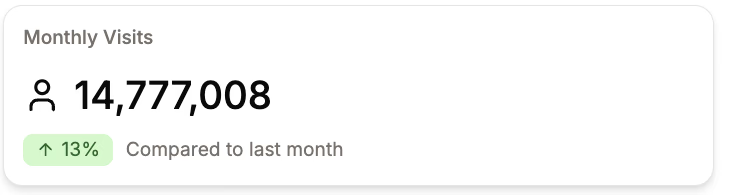
If your traffic is flat and theirs is growing, evaluate what channels they're winning in. Are they spending on ads, ranking on SEO, or getting viral on social? Combine this with their top landing pages and creatives to find where their surge comes from.
Estimated Revenue
Trendtrack provides a revenue range (e.g., $6.5M–$19.4M/month). This puts their scale in perspective and helps you decide whether their strategies are feasible to replicate.
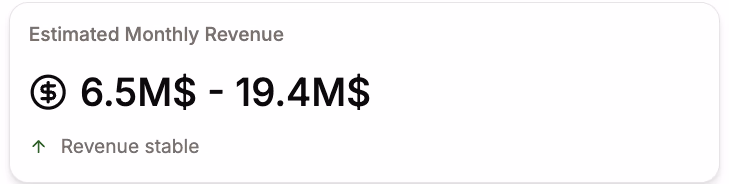
A brand making $500k/month likely has a lean team and systems that are scalable for small-to-mid shops. In contrast, a $20M/month operation may rely on high-budget campaigns that aren’t replicable—but their funnels still offer clues.
Traffic Over Time
Visualize growth with a line chart showing traffic by month. This helps distinguish fads from sustainable brands.
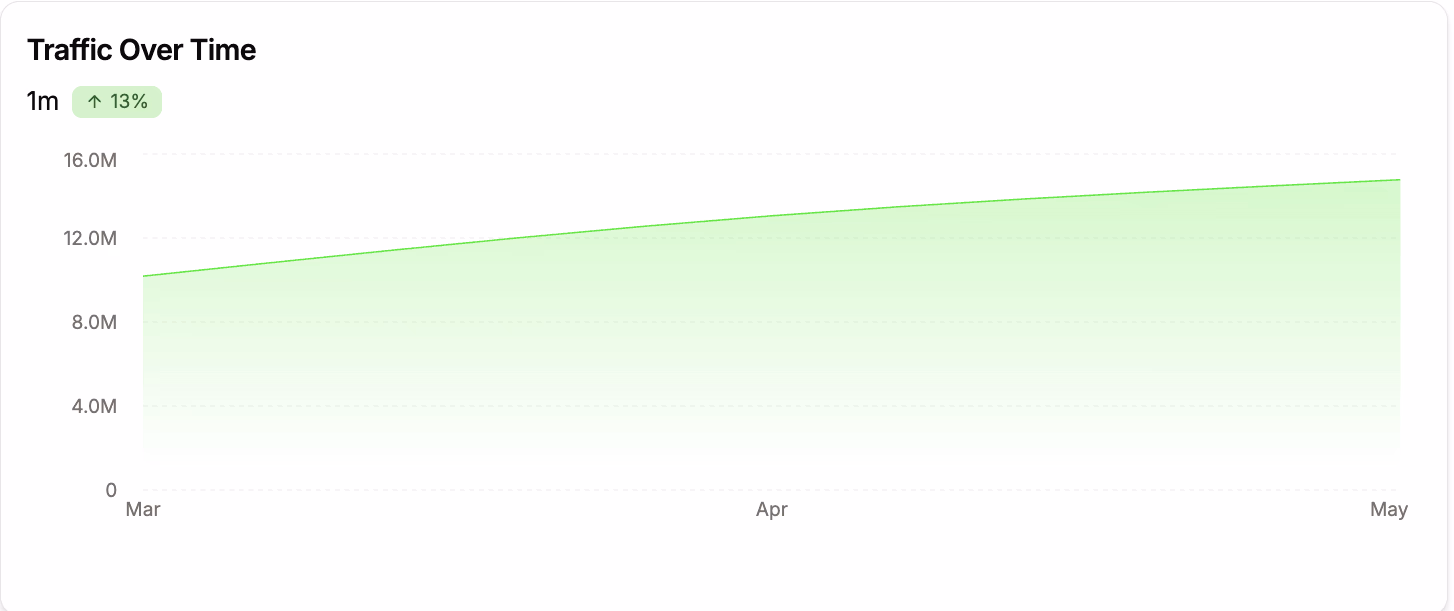
A 3-month spike might mean influencer virality or a product trend. A steady 12-month incline? That’s operational excellence, worth dissecting deeply.
Traffic by Country
View a breakdown of visitor countries. If 40% of their traffic is from Canada or Germany, they may be scaling in under-served regions.
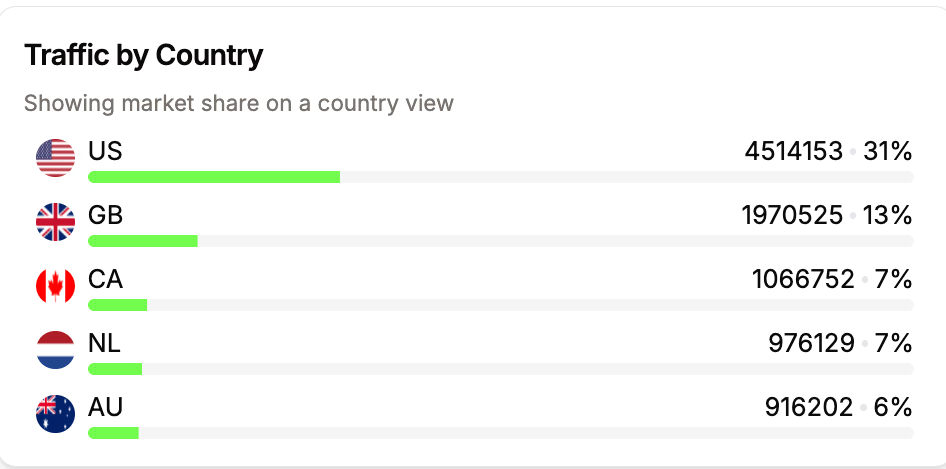
Discover untapped geographic markets. A competitor growing in Australia? You can localize your ad creative or test new shipping options for that region.
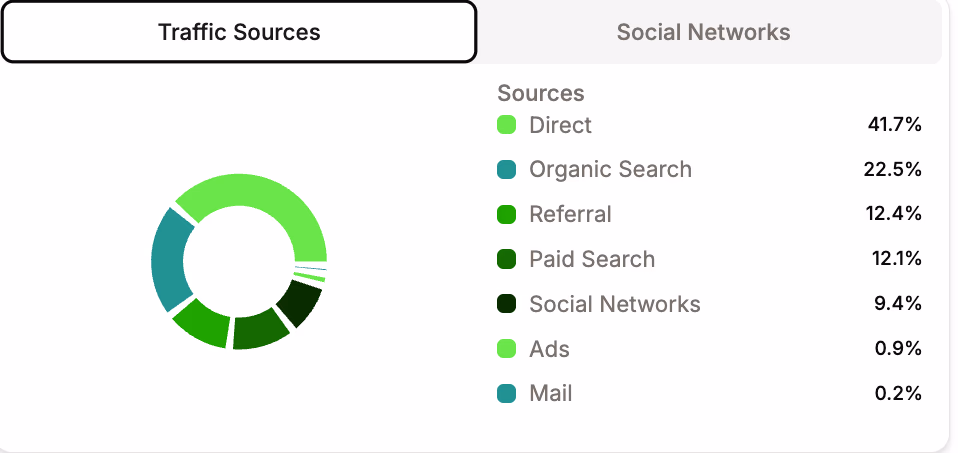
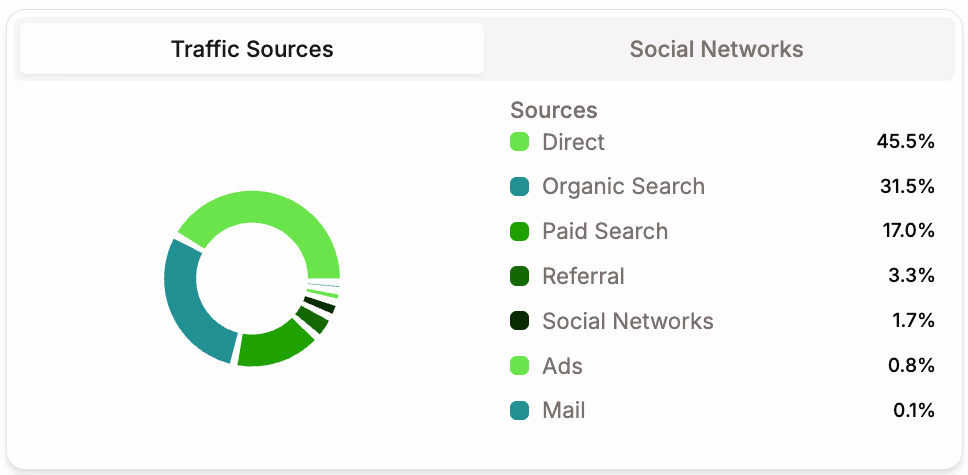
Traffic Sources
Find out whether traffic is driven by direct, organic, paid, social, or referral sources.
If a brand relies heavily on paid traffic, you can reverse-engineer their ad strategy in the next tab. If they dominate organic, look at their blog, site structure, and backlinks. Social-heavy brands might be UGC or influencer driven.
Pixel Stack
This reveals which analytics and marketing tools the store uses. Such as Meta Pixel, TikTok Pixel, GA4, Klaviyo, or Hotjar.
A great tech stack usually means they’re actively retargeting, running advanced email flows, or testing. If a store lacks pixels, it might be under-leveraged, a possible edge for you.
Deep Dive with BrandTracker
Once you’ve identified a competitor, BrandTracker helps you examine. You can monitor their ad strategy, landing pages, and campaign momentum over time. It turns short-term snapshots into long-term competitive intelligence.
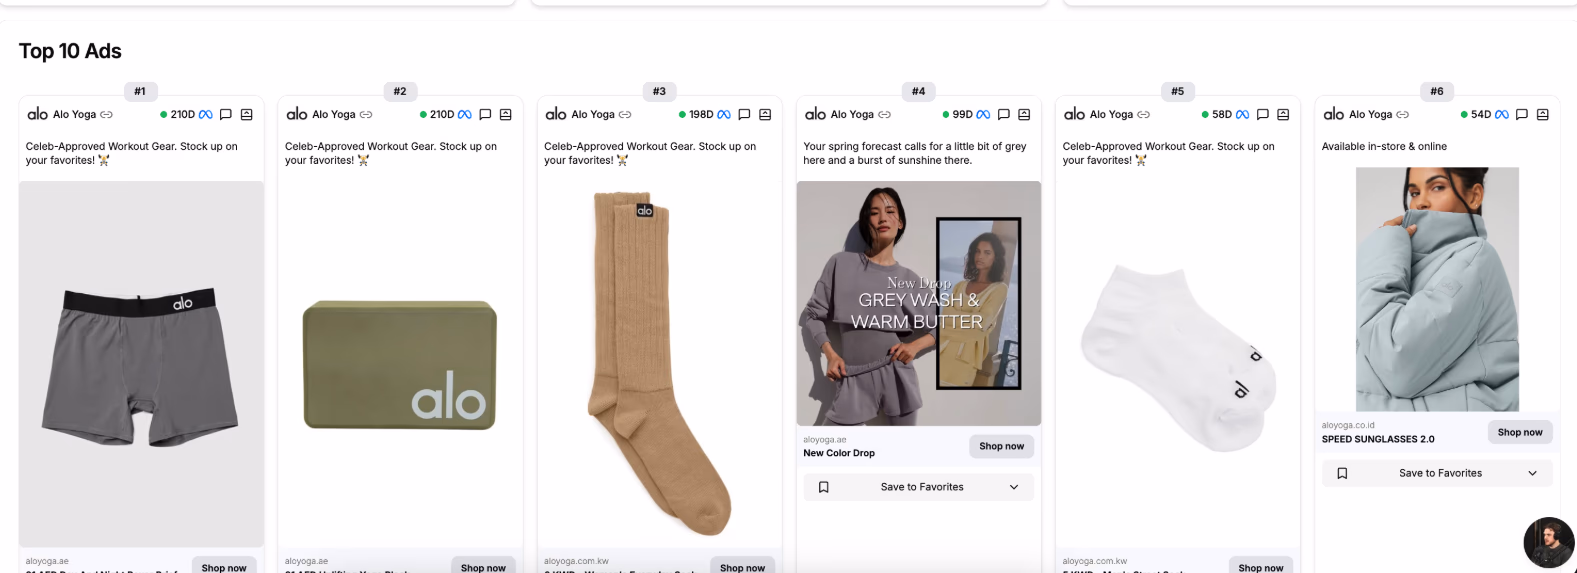
Active Ads Count
BrandTracker shows how many creatives a brand is currently running (e.g., 744 for Alo Yoga). High volumes mean they’re testing aggressively.
If a competitor runs 600+ ads simultaneously, it likely indicates a sophisticated team using dynamic creative testing (DCT). It also tells you how frequently they refresh content. Useful if your own ads fatigue quickly.
Ad Types
You can see the mix of creative formats—video, carousel, static image, or dynamic product ads (DPA/DCO).
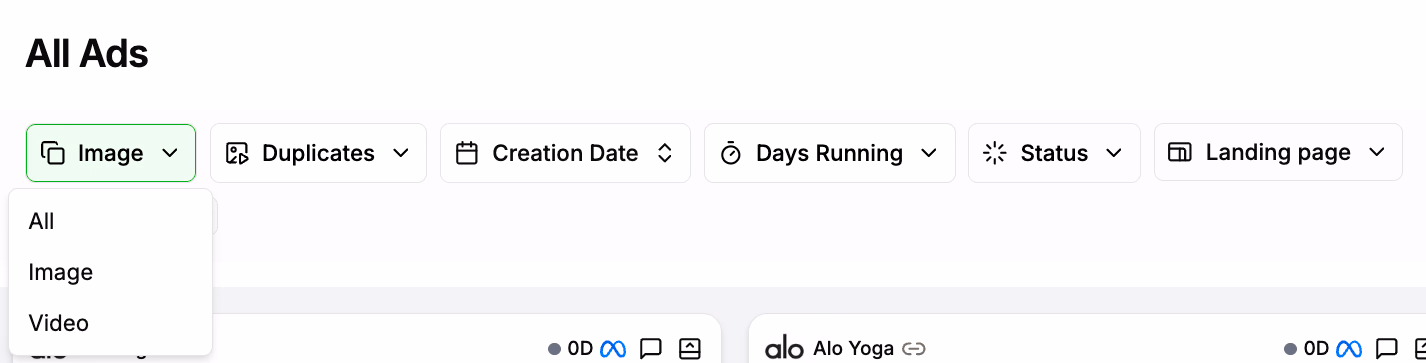
If a brand leans heavily on dynamic creatives, they may be using automated personalization through Meta’s or TikTok’s AI. If you see a high percentage of videos, study their style: is it UGC or branded content? This informs your own creative production priorities.
Top Landing Pages
This shows the URLs most frequently promoted in their ads. Expect links to product pages, quiz funnels, collections, or limited-time offers.
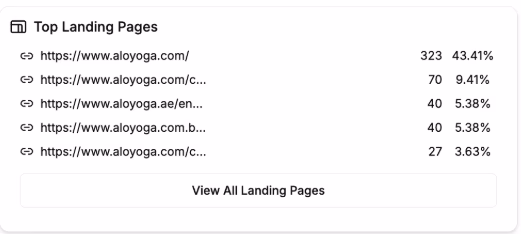
Analyzing these pages gives direct insight into their conversion strategy. Is their best ad sending traffic to a product quiz, bundle builder, or urgency-based landing page? Recreate the structure, messaging, or offer logic to test in your store.
Ads Launched Trend
Track how many new ads the brand launches each month. Sudden spikes often indicate product launches or seasonal pushes.
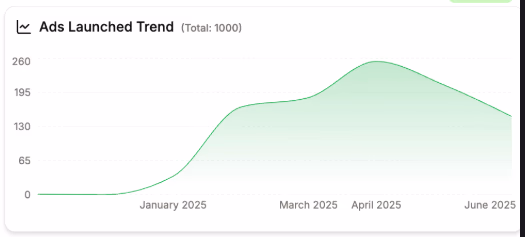
A spike in April might hint at a Mother’s Day push. A consistent upward trend shows increasing investment—often aligned with revenue growth. You can time your campaigns around similar cycles.
Skyrocket Your E-commerce Growth
Access data-driven insights to supercharge your Shopify sales and dominate your niche effortlessly.
Creative Themes and Messaging (add-on insight)
Though not a labeled metric in BrandTracker, you can spot emerging themes by analyzing their latest ad batches. Color schemes, keywords, hooks, influencers.
If a brand pivots from “eco-friendly” to “military-grade durability,” it signals a repositioning you can respond to or learn from. Matching messaging cadence to buyer psychology (seasonal pain points, gift-giving periods) can lift your ROAS significantly.
Want to go even deeper on dissecting ad creative mix and tracking competitor campaigns across platforms? Explore practical tips and tool recommendations in this guide to the best ad spy tools.
Practical Example: Analyzing a Shopify Store for a Neck Pillow Brand
Let's imagine you are an entrepreneur launching a Shopify store focused on premium neck pillows. You are targeting frequent travelers and commuters.
Step 1: Identifying Real Competitors with Trendtrack
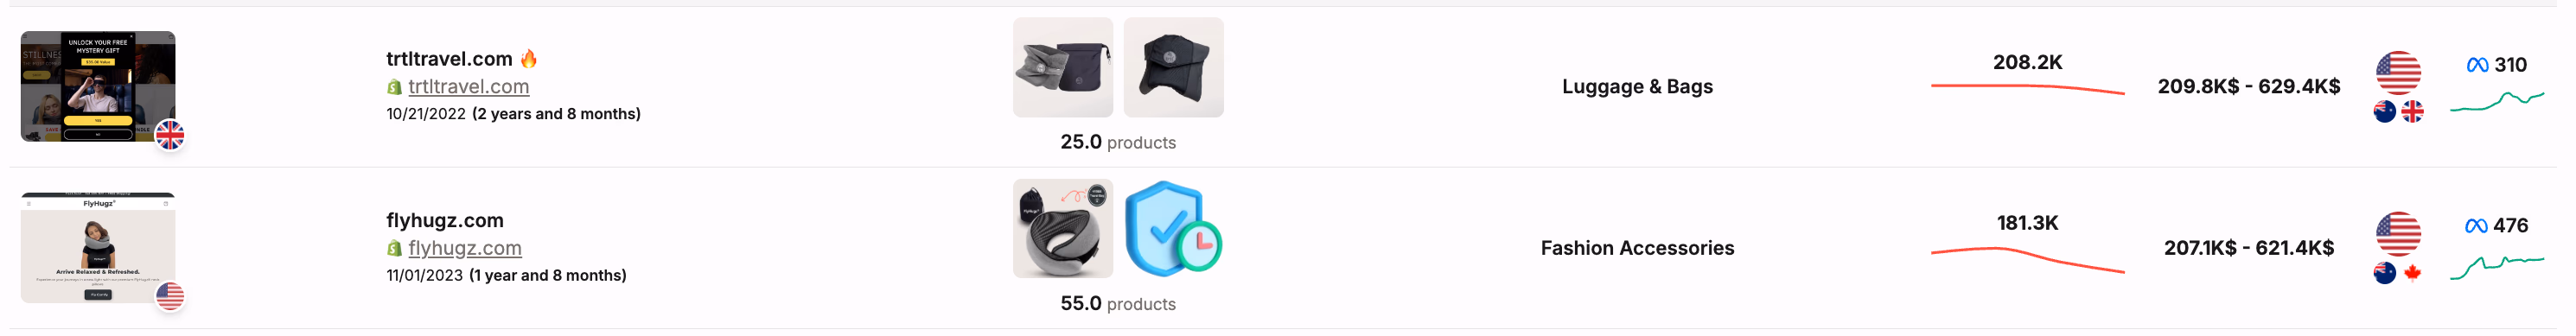
Two strong examples appear:
Competitor | Products | Category | Monthly Traffic | Estimated Revenue Range | Key Markets | Active Ads |
|---|---|---|---|---|---|---|
trtltravel.com | 25 | Luggage & Bags | 208.2K | $209.8K – $629.4K | US, UK, Australia | 310 |
flyhugz.com | 55 | Fashion Accessories | 181.3K | $207.1K – $621.4K | US, Canada, Australia | 476 |
Both stores operate in the neck pillow and travel comfort space, making them ideal benchmarks.
Step 2: Reverse-Engineering Competitor Performance
Trendtrack reveals useful insights:
- trtltravel.com shows stable traffic around 208,000 visits per month and estimated revenue exceeding $200,000
- Their primary markets include the United States, United Kingdom, and Australia
- They run over 310 active ads, indicating a consistent paid traffic strategy
Similarly:
- flyhugz.com attracts approximately 181,000 monthly visits
- Estimated revenue is comparable to TrtlTravel, between $207,000 – $621,000
- They rely heavily on paid ads, with 476 active creatives,** suggesting aggressive advertising and testing
- Their key markets are the US, Canada, and Australia
You can infer that a high-performing neck pillow brand typically operates with 200,000+ monthly visitors, generates mid six-figure revenue. Plus, they invest heavily in paid traffic.
Step 3: Setting Performance Benchmarks
You now have realistic targets:
- Conversion Rate: If these competitors generate $600K on 200K monthly visits, estimated conversion rates are in the 2-3% range
- Market Focus: Prioritizing the US, UK, Canada, and Australia, as these regions consistently appear in the top-performing stores
- Advertising Strategy: Launching with paid ads is essential. Given the competitors run hundreds of creatives, building a structured testing process for ads will be critical
- Product Range: Both competitors carry 25 to 55 products. This suggests that starting with a focused, well-curated catalog works in this niche
With real-world competitor insights from Trendtrack, you can replace vague assumptions with clear benchmarks. With that, you can improve your chances of building a high-performing Shopify store in the neck pillow market.
Track Competitor Stores
Monitor your competitors' every move. Get insights on their traffic, best-sellers, apps, and marketing strategies to stay one step ahead.
Master Your Store Analysis Strategy
Learning how to analyse Shopify stores effectively transforms scattered data points. You can easliy find clear growth opportunities over time.
The combination of native Shopify analytics with competitive intelligence tools like Trendtrack creates a comprehensive view. Most merchants never achieve this. The tools gives you the strategic advantage needed to identify winning products before they saturate the market.
Start with your own store's performance metrics. Expand into competitor research, and build systematic analysis routines that turn insights into measurable revenue growth.


.avif)


Are you ready to get the insights?
From viral trends to million-dollar stores — unlock the insights behind what sells, scales, and converts. All in one place.